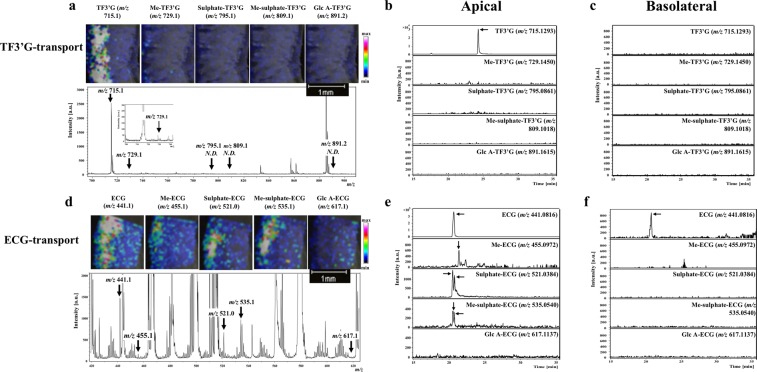
Figure 4.
MALDI-MSI analyses of the metabolites TF3′G and ECG in jejunum membranes subjected to 60-min transport experiments in the presence of 20 µM cyclosporine A. TF3′G (m/z 715.1) and its metabolites [Me-TF3′G (m/z 729.1), sulphate-TF3′G (m/z 795.1), Me-sulphate-TF3′G (m/z 809.1), Glc A-TF3′G (m/z 891.2)] were visualised via MALDI-MSI in the negative ion-linear mode at a spatial resolution of 50 µm using nifedipine/phytic acid as the matrix reagent (a). ECG (m/z 441.1) and its metabolites [Me-ECG (m/z 455.1), sulphate-ECG (m/z 521.0), Me-sulphate-ECG (m/z 535.1), Glc A-ECG (m/z 617.1)] were visualised via MALDI-MSI in the negative ion-linear mode at a spatial resolution of 50 µm using nifedipine/phytic acid as the matrix reagent (d). Intensity signals corresponding to TF3′G, ECG, and their metabolites are shown as fixed pseudocolour scales. LC-TOF-MS chromatograms of TF3′G and its metabolites in the apical (b) and the basolateral solutions (c) were obtained after 60-min transport experiments using the SD rat jejunum membrane. LC-TOF-MS chromatograms of ECG and its metabolites in the apical (e) and the basolateral solutions (f) were obtained after 60-min transport experiments using the SD rat jejunum membrane. Detailed LC-TOF-MS conditions are described in the Methods section.

