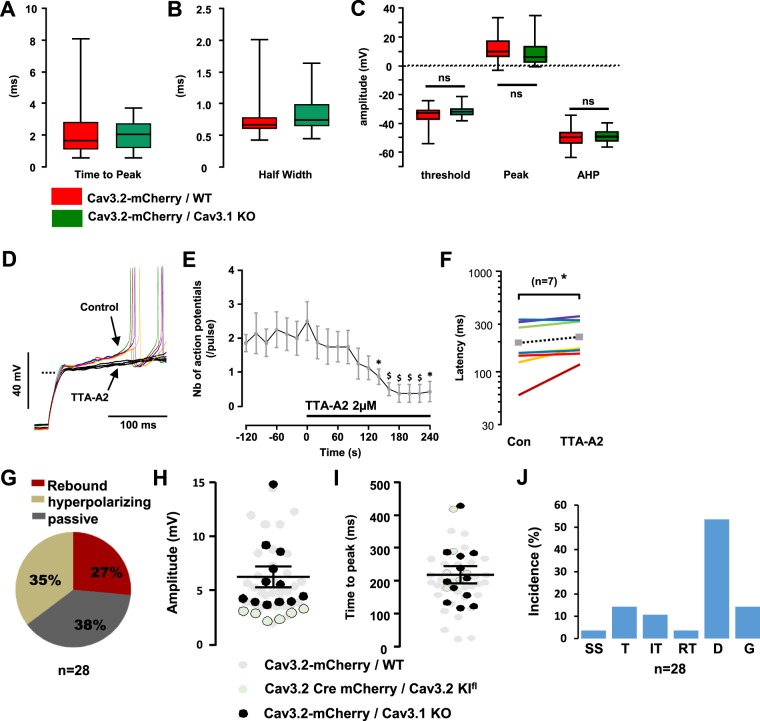
Figure 9.
Electrophysiological properties of Cav3.2-expressing LII neurons lacking Cav3.1. (A–C) Box and whiskers representations of action potential’s time-to-peak (A), half width (B), and amplitudes (C) in mCherry-expressing neurons from either AAV-DJ-Cav3.2-mCherry injected wild-type mice (red, from Fig.) or AAV-DJ-Cav3.2-mCherry injected Cav3.1 knockout mice (green). In (B and C): $p < 0.01; *p < 0.05, using a Wilcoxon paired test. (D) Raw voltage traces in a mCherry positive neuron, in the absence (colored lines) and presence of 2 µM TTA-A2 (black lines), recorded in a Cav3.1 knockout mouse injected with the AAV-DJ-Cav3.2-mCherry. Steps were elicited from ~−100 mV; the dotted line indicates −60 mV. (E) Mean number of action potentials triggered during a 200ms-long pulse (as shown in (D)), in the absence and presence of 2 µM TTA-A2 (as indicated by the solid line), in 7 Cav3.2-positive/Cav3.1-negative neurons. Symbols are the means and lines are the SEM. (F) Mean latency of the first action potential (same experiments as in E) triggered in the absence and presence of 2 µM TTA-A2 (as shown by the lines), in 7 Cav3.2-positive/Cav3.1-negative neurons. Symbols are the means. (G) Proportions of the subthreshold properties of Cav3.2-positive/Cav3.1-negative neurons. (H,I) Amplitudes (H) and time-to-peak (I) of the suprathreshold rebounds in Cav3.2-positive/Cav3.1-negative LII neurons (black dots, n = 12). Similar results from Cav3.2-expressing neurons (grey dots, from Fig.) and from Cav3.2-deleted neurons (white dots, from Fig.) are shown for a comparison. Lines are mean and SEM. (J) Firing patterns in Cav3.2-positive/Cav3.1-negative LII neurons, recorded in the current clamp mode of the whole-cell patch clamp technique. SS (Single spiking), T (Transient), IT (Irregular Tonic), RT (Regular Tonic), D (Delayed) and G (Gap), see Fig. S3 for explanations.

