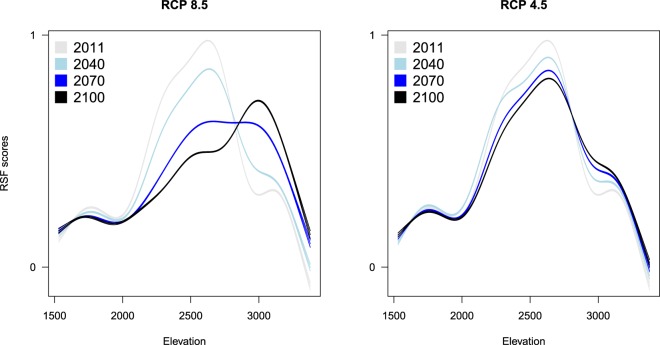
Figure 5.
Variation in male ibex resource selection scores plotted against elevation as predicted by RSFs built considering different projected climate change scenarios (RCP 8.5, RCP 4.5). Lines represent predictions by generalized additive linear models (bounded by 95% CI), which were fitted on RSF scores to visualize the shift in ibex selection for higher elevation over time. RSF scores were standardized from 0 to 1 and are proportional to the relative probability of selection.

