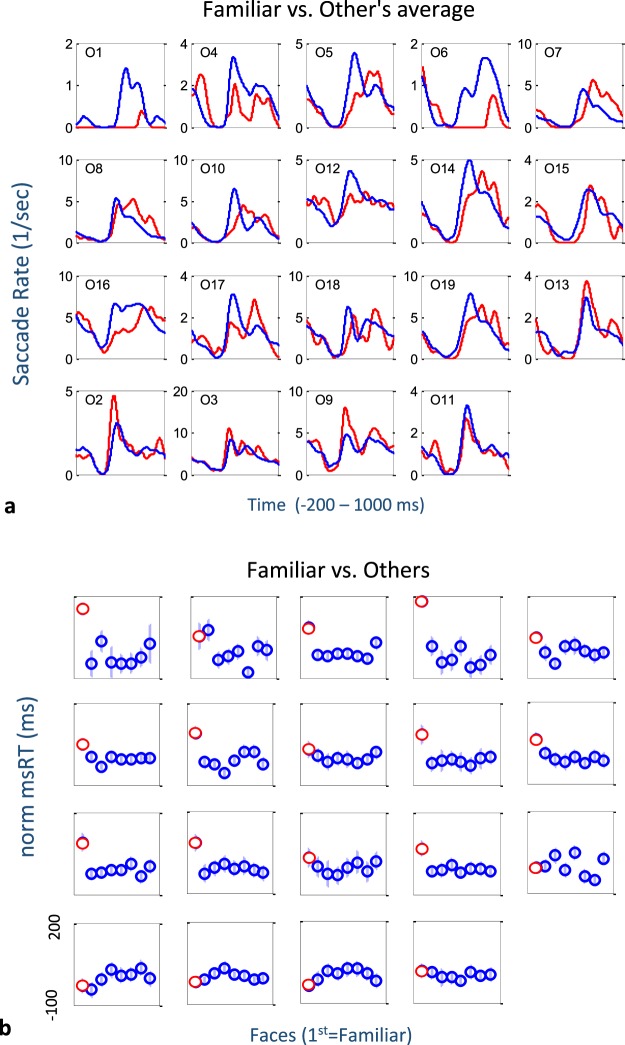
Figure 4.
Individual observer data. (a) Microsaccade rate modulation functions for each observer, for the familiar face (red) compared to the average of all other faces. (b) Normalized msRT values in the release interval (250–800 ms post stimulus) for each observer and face (1–8, 1 = familiar in red). In both cases, data were ordered so that observers showing the group average effect appear in the first 3 rows. Note the delayed release from inhibition (a) and the typically longer msRT (b) for the familiar face compared to the other faces.

