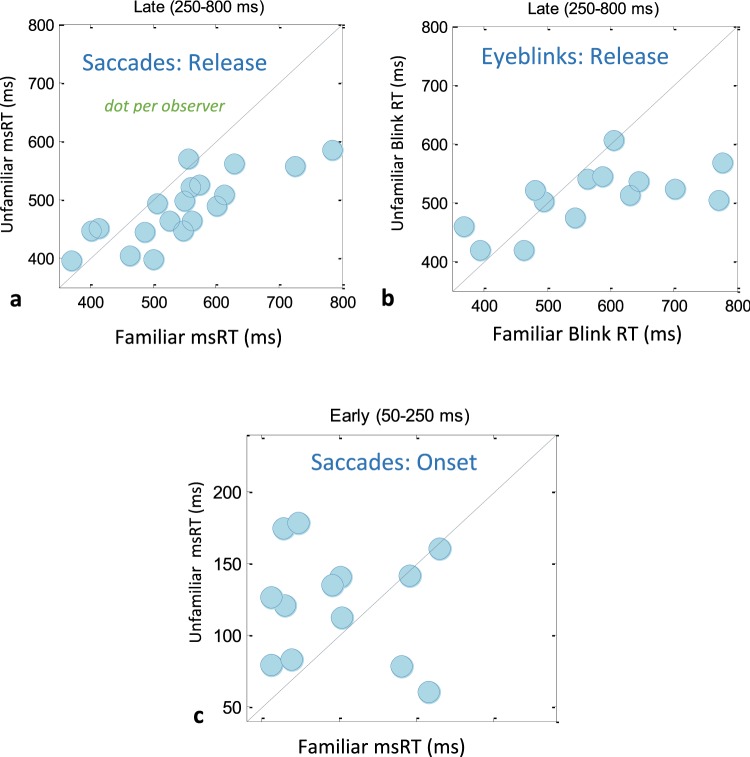
Figure 5.
The relation between the oculomotor inhibition for familiar and unfamiliar faces. Observer scatter plots show the oculomotor RT for the familiar face on X and average of all unfamiliar faces on Y, with each dot representing one observer. The diagonal line represents the points of equality. (a) Microsaccade RT for the inhibition release (250–800), (b) Eyeblink RT for the inhibition release, (c) microsaccade RT for the onset of inhibition (50–250 ms). The results for eyeblinks do not include all observers because of a lack of blinking in the specific time-period investigated (see Methods). Similarly, the onset of microsaccade inhibition (c) includes only 13 observers. Note that in (a) and (b), the majority of the dots reside in the lower-right half of the figure, indicating prolonged inhibition for the familiar, while earlier inhibition onset for the familiar is indicated by the shorter msRT for the familiar (c).

