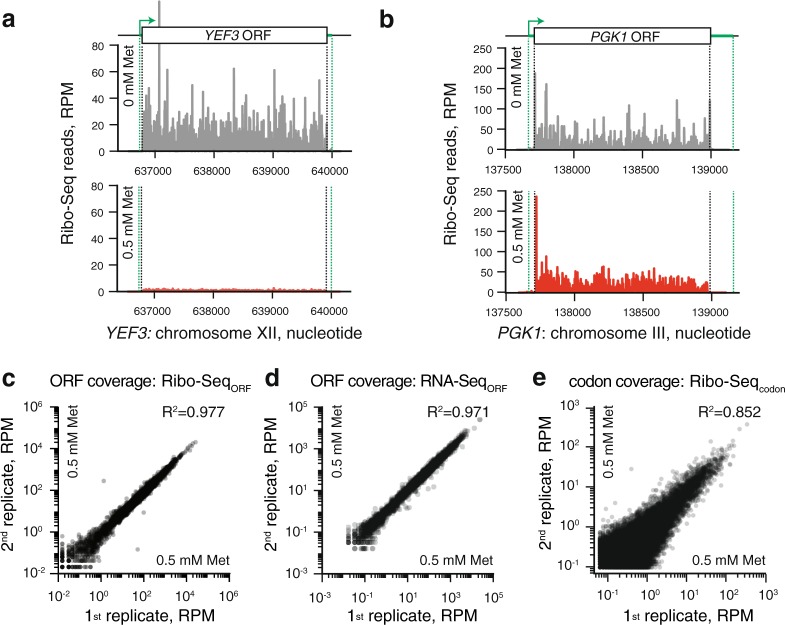
Figure 2.
Reproducibility and specificity of Ribo-Seq and RNA-Seq datasets. Ribosome footprint density along the YEF3 (a) and PGK1 (b) genes in the absence of methionine (upper panel, grey trace, no repression of eEF3 expression) and presence of 0.5 mM methionine (lower panel, red trace, repression of eEF3 expression). Green dotted lines indicate mRNA 3′ and 5′ ends. Reproducibility of ribosome footprint (c and e) and RNA-Seq (d) densities between the two biological replicates. Read density is normalised in reads per million (RPM) of total reads, and is quantified either for individual ORFs (c, d) or individual codons (e).

