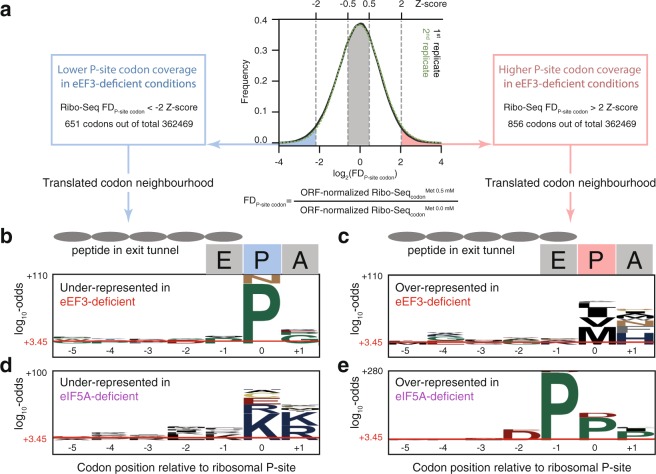
Figure 5.
Amino acid- and position-specific redistribution of ribosomal density upon depletion of eEF3 or eIF5A. (a) Distribution of genomic sites (codons) according to the relative fold difference (FD) in the ribosome density between eEF3-deficient and eEF3-proficient cells. Positive FD values (right side of the distribution) indicate the sites where depletion of the factor leads to an increase in ribosome density, and negative FD values correspond to a relative decrease in ribosome density upon depletion of the factor. pLogo39 was used to calculate overrepresentation of specific amino acids at positions relative to the P-site codon using codons with Z-score <-2 (eEF3: panel b, 651 codon positions; eIF5A32: panel d, 510 codon positions) and >2 (eEF3: panel c, 856 codon positions; eIF5A32: panel e, 998 codon positions) that are common for both biological replicates. Horizontal red lines on the pLogos represent significance threshold (the log10-odds 3.45) corresponding to a Bonferroni corrected p-value of 0.05.

