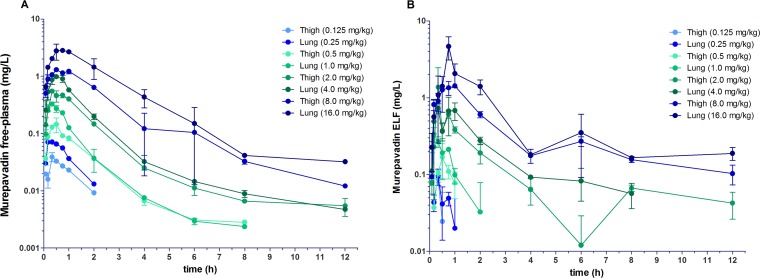
FIG 1.
Single dose time-concentration profiles of eight 2-fold increasing doses of murepavadin by s.c. injection. Four doses were applied in the thigh infection model (0.125, 0.5, 2, and 8 mg/kg) and four in the lung infection model (0.25, 1, 4, and 16 mg/kg). Shown are the free murepavadin time-concentration profile in plasma (A) and the ELF time-concentration profile (B). Each symbol represents the mean ± SD of the results from two mice.

