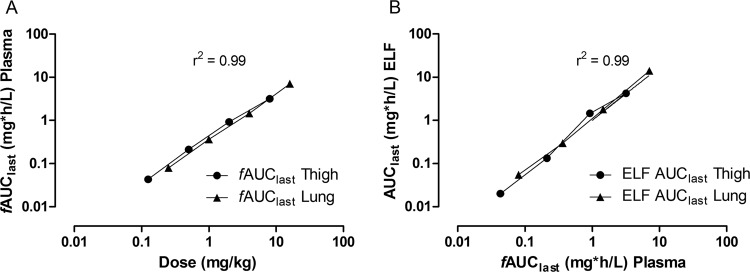
FIG 2.
Dose-proportionality plot of murepavadin (A) and relationship of free AUC (plasma) to the ELF AUC of murepavadin (B). Eight different doses of murepavadin were administered to mice by s.c. injection, with four doses in the thigh infection model and four doses in the lung infection model. Each symbol represents the exposure per dose. The linear regression line is indicated, and R2 represents the coefficient of determination. Analysis was conducted using GraphPad Prism version 5.03 for Windows (GraphPad Software, La Jolla, CA, USA).

