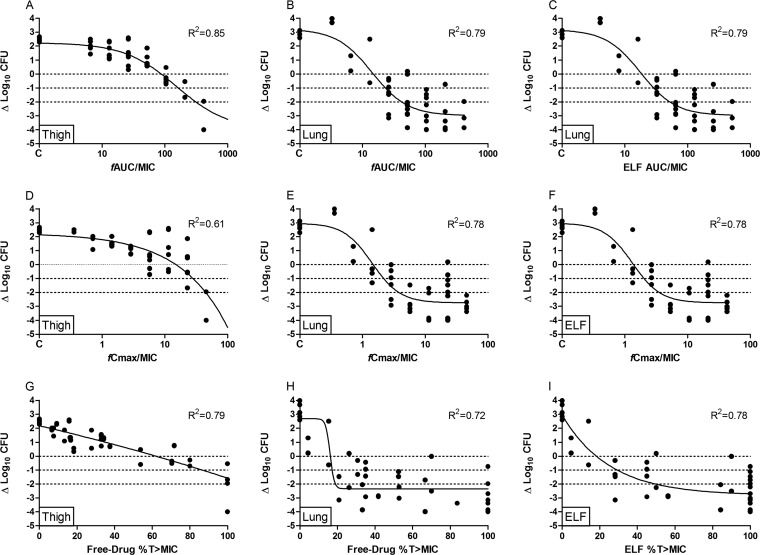
FIG 3.
Relationships of murepavadin 24-h AUC/MIC (A to C), Cmax/MIC (D to F), and the percentage of time above the MIC (%T>MIC) (G to I) for P. aeruginosa ATCC 27853 in the neutropenic thigh and lung infection models with change in CFU per thigh or lung from start of treatment and after 24 h of therapy. Each symbol represents a therapy response in one mouse thigh or lung. The line is the best-fit line based on the sigmoid Emax model.

