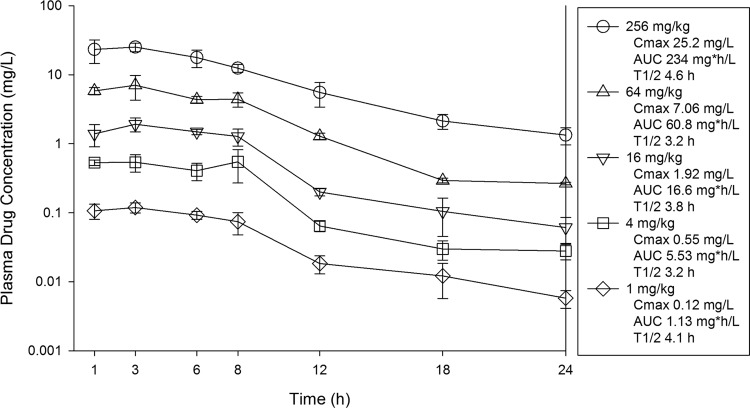
FIG 1.
Plasma concentrations of KBP-7072 in mice following single subcutaneous doses. Samples were obtained at seven time points over 24 h. Each symbol represents the mean ± SD for three animals. Shown in the key are the maximum plasma concentration (Cmax), the area under the concentration-time curve from 0 h to infinity (AUC), and the elimination half-life (t1/2) for each dose.

