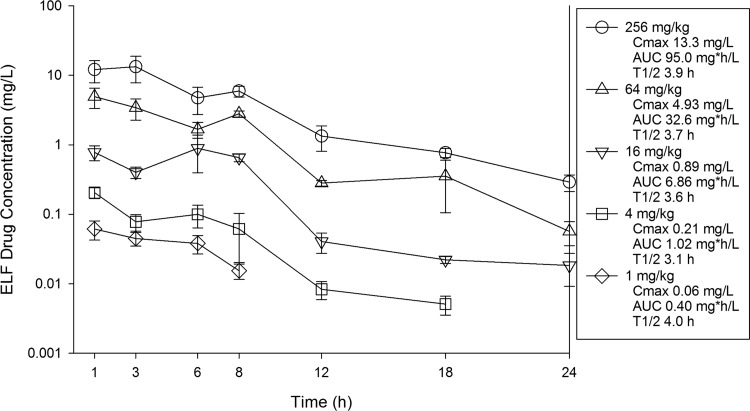
FIG 2.
ELF concentrations of KBP-7072 in mice following single subcutaneous doses. Samples were obtained at seven time points over 24 h. ELF concentrations were determined using urea concentration correction methods. Each symbol represents the mean ± SD for three animals. Shown in the key are the maximum ELF concentration (Cmax), the area under the concentration-time curve from 0 h to infinity (AUC), and the elimination half-life (t1/2) for each dose.

