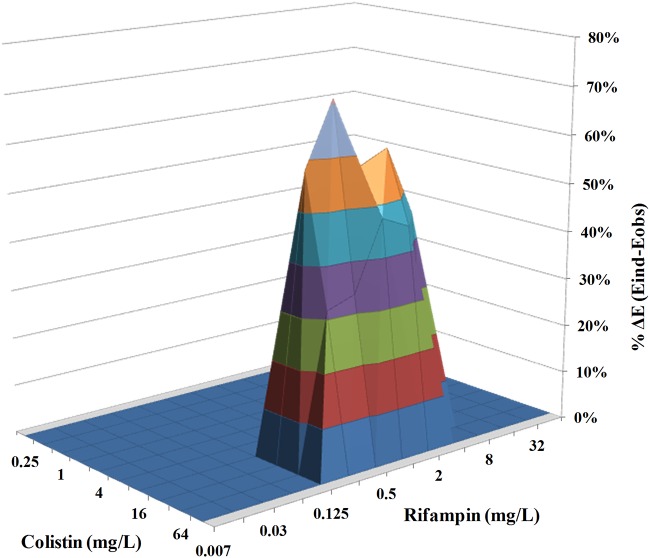
FIG 2.
In vitro interaction between colistin (0.25 to 128 mg/liter) and rifampin (0.007 to 64 mg/liter) against carbapenem-resistant K. pneumoniae biofilms. The x axis and y axis represent the concentrations of colistin and rifampin, and the z axis represents the percent ΔE (see the text). The zero plane (ΔE = 0) represents indifferent interactions, whereas volumes above (ΔE > 0) represent statistically significant synergistic interactions. The magnitude of the synergistic interactions is directly related to positive ΔE values. The different colors in the three-dimensional plots represent different percentile bands of synergy. The percent ΔE ± SE was 49.9% ± 9.2% for the colistin-rifampin combination (synergistic interaction).

