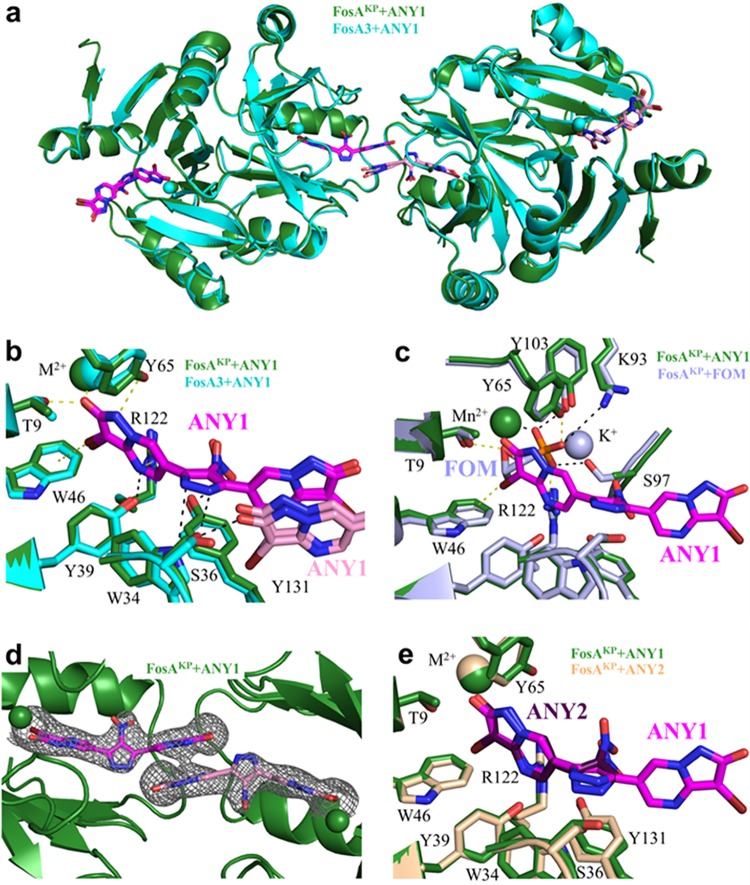
FIG 3.
Three-dimensional structures of FosAKP or FosA3 in complex with ANY1 or ANY2. (a) Overlay of FosAKP and FosA3, both in complex with ANY1, as indicated. Two adjacent FosA dimers are shown. (b) Residues in FosAKP and FosA3 that interact with ANY1. Yellow dashed lines represent contacts shared between FosA and ANY1/FOM, while black dashed lines represent contacts unique to FosA and ANY1. The pyrazolopyrimidine moiety (pink) of the ANY1 molecule from the adjacent FosA molecule is also shown. (c) Overlay of FosAKP in complex with ANY1 and in complex with FOM, as indicated (PDB accession number 5V3D). Yellow dashed lines represent contacts shared between FosA and ANY1/fosfomycin, while black dashed lines represent contacts unique to FosA and FOM. (d) Structure of FosAKP highlighting electron density surrounding two ANY1 molecules that link adjacent FosAKP active sites. Electron density was generated from composite omit maps, contoured to 1.5 σ and carved to 2 Å from ANY1. (e) Overlay of FosAKP in complex with ANY1 or ANY2, as indicated.

