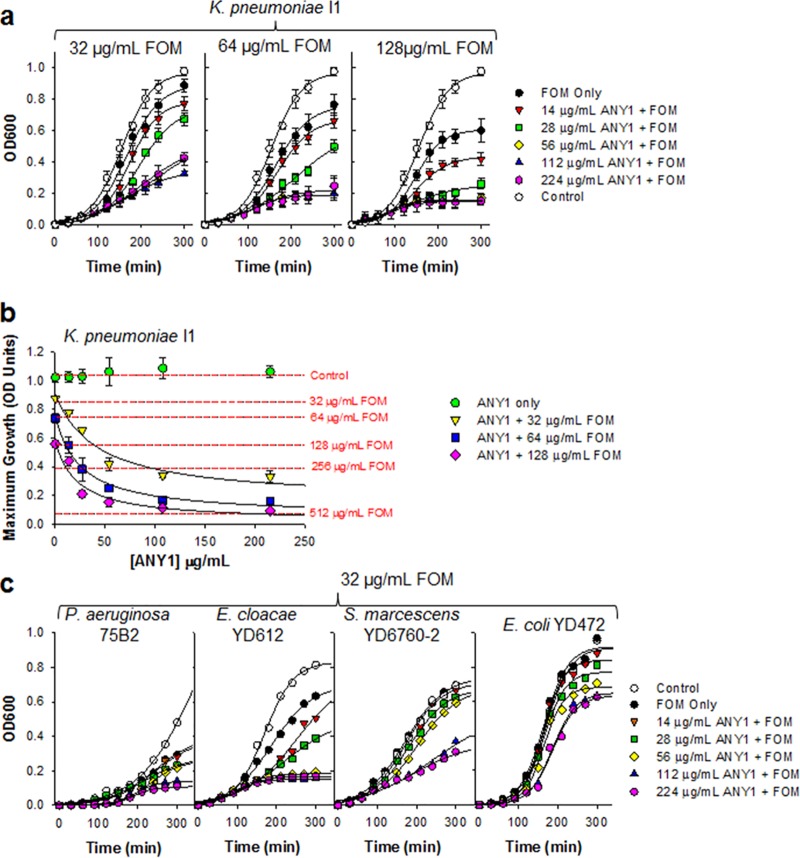
FIG 5.
Bacterial growth curves of K. pneumoniae I1, P. aeruginosa 75B2, E. cloacae YDC612, S. marcescens YDC760-2 or E. coli YD472 in the presence of a fixed concentration of FOM and different concentrations of ANY1 (0 to 224 μg/ml). (a) Growth curve of K. pneumoniae I1 in the presence of 32, 64, or 128 μg/ml FOM and different concentrations of ANY1 (0 to 224 μg/ml). (b) Analysis of the data shown in panel a illustrating changes in the maximum growth asymptote (OD units) as a function of FOM (red dotted lines) and ANY1 with or without FOM at the concentrations indicated in the legend on the figure. (c) Growth curve of P. aeruginosa 75B2, E. cloacae YDC612, S. marcescens YDC760-2, and E. coli YD472 in the presence of 32, 64, or 128 μg/ml FOM and different concentrations of ANY1 (0 to 224 μg/ml).

