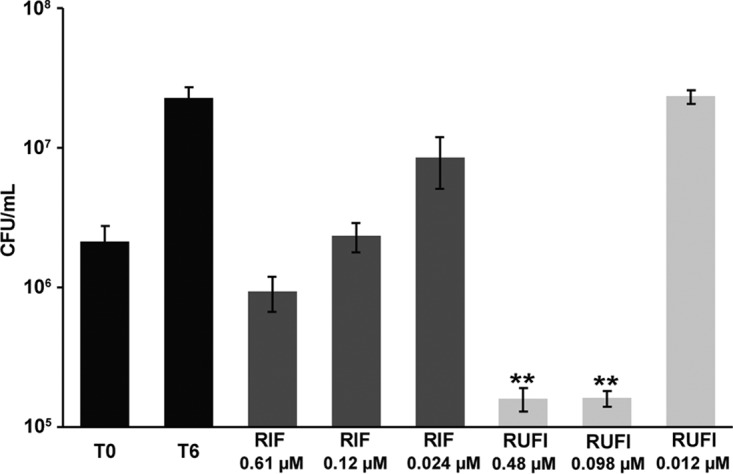
FIG 5.

Activity of RUFI against M. tuberculosis in murine macrophages. Bars represent CFU prior to treatment (T0), no treatment (T6), and treatment with rifampin (RIF) or RUFI at the indicated concentrations. Values are means ± SDs from six measurements. According to the two-tailed t test, significant differences (P < 0.02 [**]) were observed between the untreated group (T0) and the groups treated with RUFI at 0.48 and 0.098 μM.
