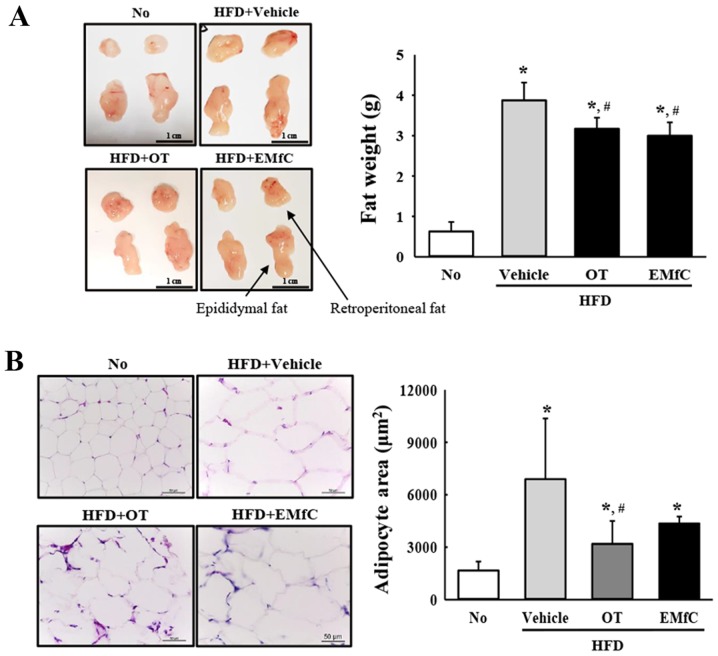
Figure 2.
Measurement of fat weight and adipocyte size. (A) Abdominal adipose tissue obtained in the No, HFD+Vehicle, HFD+OT or HFD+EMfC treated group in C57BL/6 mice. Epididymis and retroperitoneal fat was collected from the abdominal region of mice of all subset groups, and their weights were measured using an electrical balance. (B) Hematoxylin and eosin-stained photomicrographs of the epididymal adipose tissue sections (magnification, ×200). The rea of adipocyte size is also presented as graphs. Data represent the mean ± standard deviation from three replicates. *P<0.05 vs. the No treatment group; #P<0.05 vs. the HFD+Vehicle treated group. HFD, high fat diet; OT, Orlistat; EMfC, extract of mulberry leaves fermented with Cordyceps militaris.

