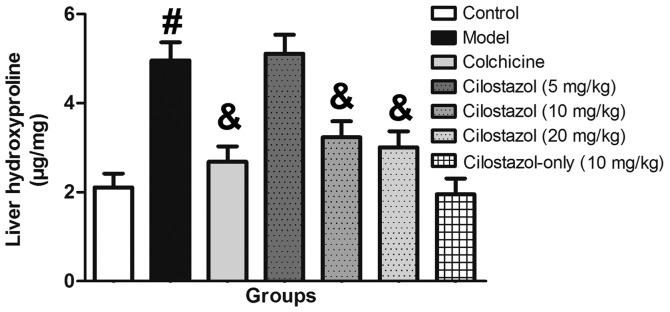
Figure 2.
Effects of cilostazol on liver hydroxyproline levels. Control, rats received no treatment; Model, rats received oral alcohol infusions to induce liver fibrosis; Colchicine, rats received oral alcohol and colchicine (0.1 mg/kg/day); Cilostazol (5, 10 or 20 mg/kg), rats received oral alcohol and cilostazol at 5, 10 or 20 mg/kg/day; Cilostazol-only (10 mg/kg), rats received oral cilostazol at 10 mg/kg/day. Data are presented as the mean ± standard deviation (n=20/group). #P<0.05 vs. Control; &P<0.05 vs. Model.

