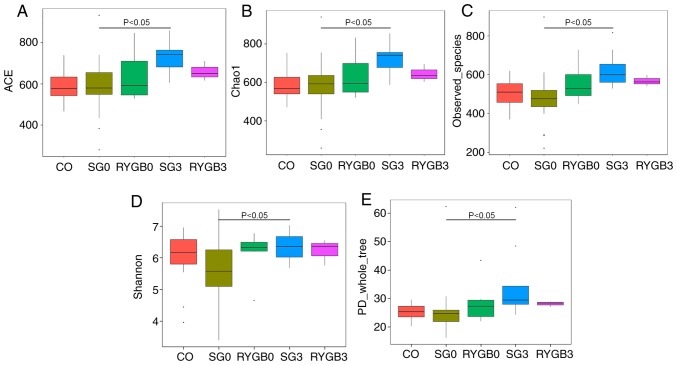
Figure 2.
α diversity in 5 groups determined by 6 different algorithms. (A) ACE; (B) chao1; (C) observed_species; (D) Shannon; (E) PD_whole_tree. No significant difference was identified in α diversity among the CO group, SG0 group and RYGB0 group. An obviously higher α diversity was obtained in the SG3 group compared with that in the SG0 group (P<0.05). A tendency of higher α diversity may be distinguished in the RYGB3 group compared with that in the RYGB0 group from A-C. The horizontal lines inside the boxes indicate the median, whereas the lower lines and upper lines of the boxes indicate the 25th and the 75th percentiles, respectively. The upper and lower ends of the vertical lines represent the maximum and minimum points of data, respectively. The dots outside the boxes indicate the outliers (an observation point whose distance from mean value is greater than double standard deviations). CO, control group; SG, sleeve gastrectomy; RYGB, Roux-en-Y gastric bypass; SG0/3, group prior to/3 months after SG; ACE, abundance-based coverage estimator; PD, phylogenetic diversity.

