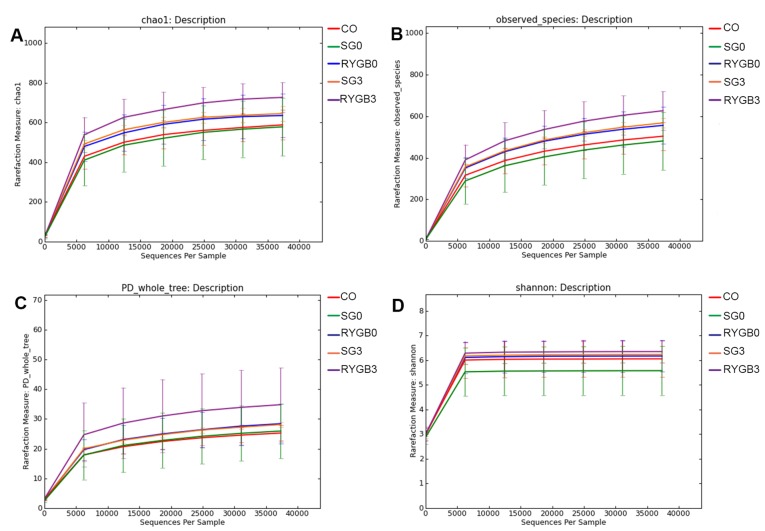
Figure 3.
Rarefaction curves according to 4 different algorithms. (A) Chao 1. (B) Observed_species. (C) PD_whole_tree. (D) Shannon. The 5 lines of 5 groups gradually became flat, which indicates that the amount of sequencing data was appropriate. In other words, increasing the amount of sequencing would not lead to the discovery of any further species. The rarefaction curve also reflected the increased α diversity in the SG3 and RYGB3 groups compared with that in the SG0 and RYGB0 groups. CO, control group; SG, sleeve gastrectomy; RYGB, Roux-en-Y gastric bypass; SG0/3, group prior to/3 months after SG; PD, phylogenetic diversity.

