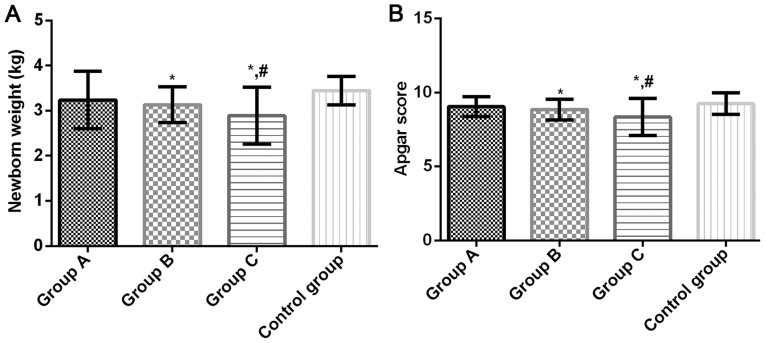
Figure 2.
(A) Comparison of neonatal weight score among four groups. Neonatal weight in groups B and C decreased significantly compared with the control group (P<0.05). Neonatal weight in group C decreased significantly compared with group A (P<0.05). There was no significant difference in neonatal weight between groups A and B and the control group (P>0.05). (B) Comparison of Apgar score in four groups. Apgar score in groups B and C decreased significantly compared with the control group (P<0.05). Apgar score in group C decreased significantly compared with group A (P<0.05). There was no significant difference in Apgar score between groups A and B and the control group (P>0.05). *P<0.05 compared with the control group; #P<0.05 compared with group A.

