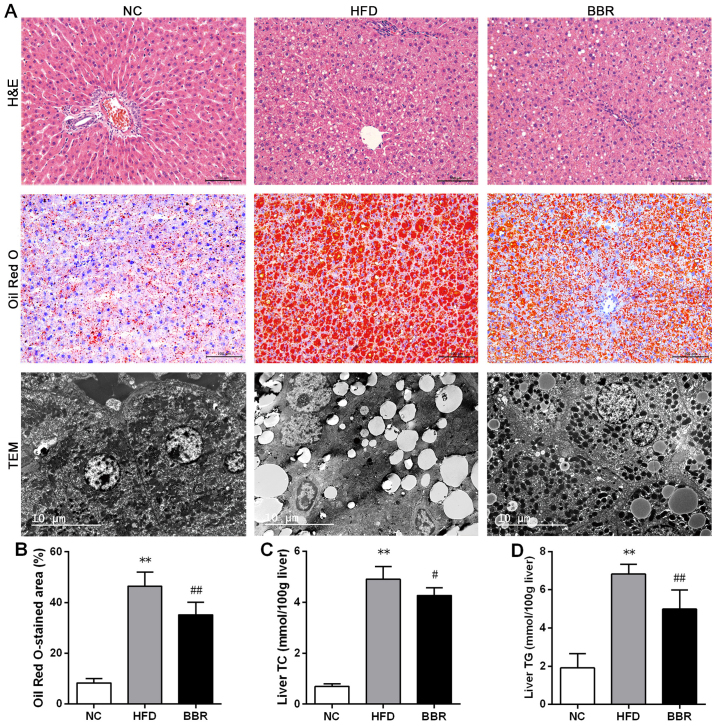
Figure 2.
BBR ameliorates HFD-induced hepatic histopathological changes and decreases liver fats. (A) Representative H&E staining (scale bar, 100 µm), Oil Red O staining (scale bar, 100 µm) and TEM (scale bar, 10 µm) of the liver tissue. (B) The percentage of Oil Red O-stained area was measured. Liver (C) TC and (D) TG levels were assayed. The values are expressed as mean ± standard deviation. **P<0.01 vs. the NC group; #P<0.05 and ##P<0.01 vs. the HFD group. NC, normal control; HFD, high-fat diet; BBR, berberine; TC, total cholesterol; TG, triglyceride; TEM, transmission electron microscopy; H&E, haematoxylin and eosin.

