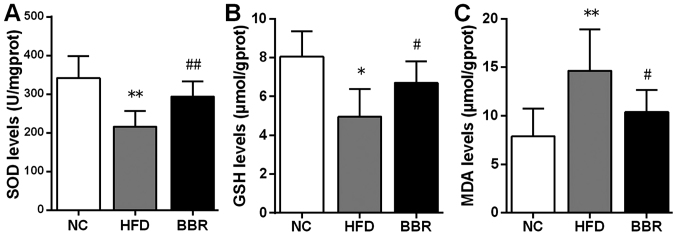
Figure 4.
BBR increases SOD and GSH, and decreases MDA. Liver levels of (A) SOD, (B) GSH and (C) MDA were assayed. The values are expressed as mean ± standard deviation. *P<0.05 and **P<0.01 vs. the NC group; #P<0.05 and ##P<0.01 vs. the HFD group. NC, normal control; HFD, high-fat diet; BBR, berberine; SOD, superoxide dismutase; GSH, glutathione; MDA, malondialdehyde.

