
FIGURE 2.
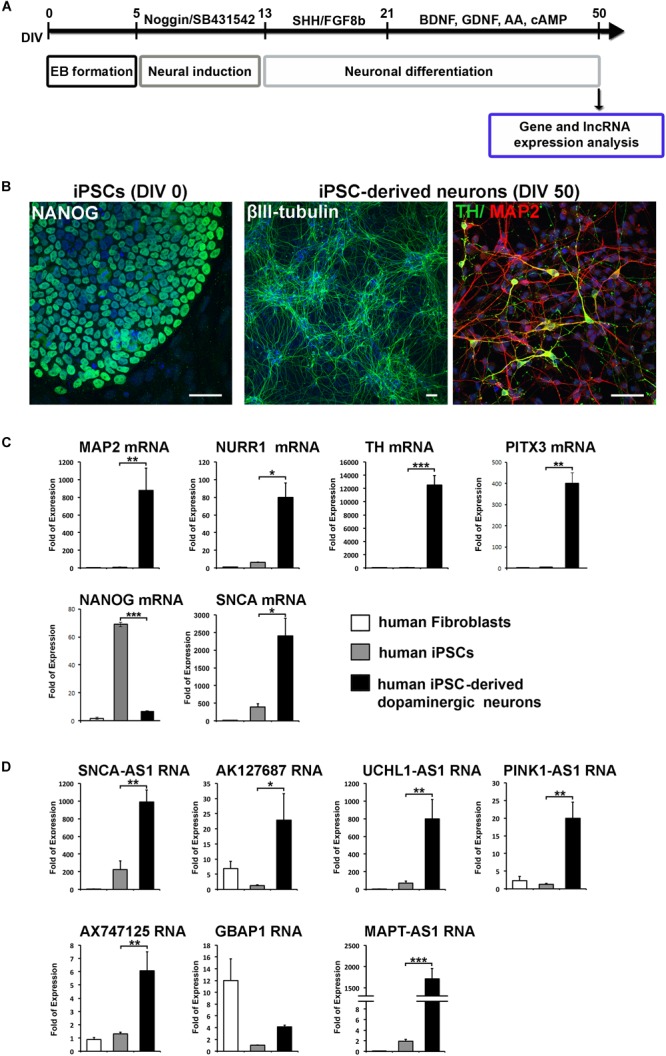
Specific expression of the identified lncRNAs in human iPSCs-derived dopaminergic neurons. (A) Schematic drawing of the protocol used for neuronal differentiation of iPSCs and timeline of analysis. At 50 DIV cells were either harvested for gene and lncRNA expression analysis or for phenotypic characterization by immunofluorescence staining. (B) Immunostaining of iPSCs for NANOG (pluripotency marker; green) and iPSC-derived neurons for βIII-tubulin (neuronal marker; green), MAP2 (neuronal marker; red) and TH (dopaminergic neuronal marker; green). Cell nuclei are counterstained with DAPI (blue). Scale bar: 40 μm. (C) Real time RT-qPCR analysis showing the relative mRNA expression of NANOG (pluripotency), SNCA, MAP2 (neuronal marker) and dopaminergic lineage markers NURR1, TH, and PITX3, normalized to relative GAPDH levels, in human fibroblasts, iPSCs and iPSC-derived neurons. (D) Real time RT-qPCR analysis showing the relative RNA expression of the identified lnc genes normalized to relative GAPDH levels in human fibroblasts, iPSCs and iPCSs-derived dopaminergic neurons. All data are presented as the mean ± SEM from three independent experiments performed in triplicates (∗p < 0.05, ∗∗p < 0.01, ∗∗∗p < 0.005, two-tailed Student’s t-test).