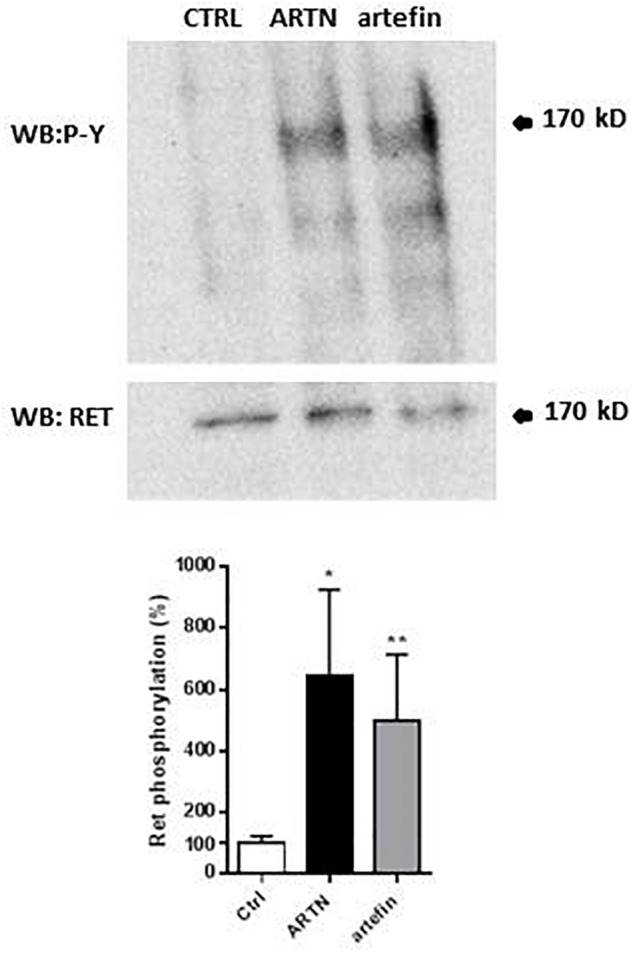
FIGURE 5.

Artemin- and artefin-induced phosphorylation of RET receptor. Serum-starved PC12-E2 cells were stimulated with 2.1 nM ARTN or 12.64 μM artefin for 10 min. Non-treated cells served as control. Lysates were prepared and examined by immunoblot for phosphotyrosine and total RET after stripping of the membrane. The bar diagram shows the phosphorylation expressed as a ratio between phosphorylated tyrosine residues and amount of total RET. The results are shown as percentage of control set at 100% and presented as mean ± SEM. The asterisks indicate the significance levels: ∗p < 0.05; ∗∗p < 0.01.
