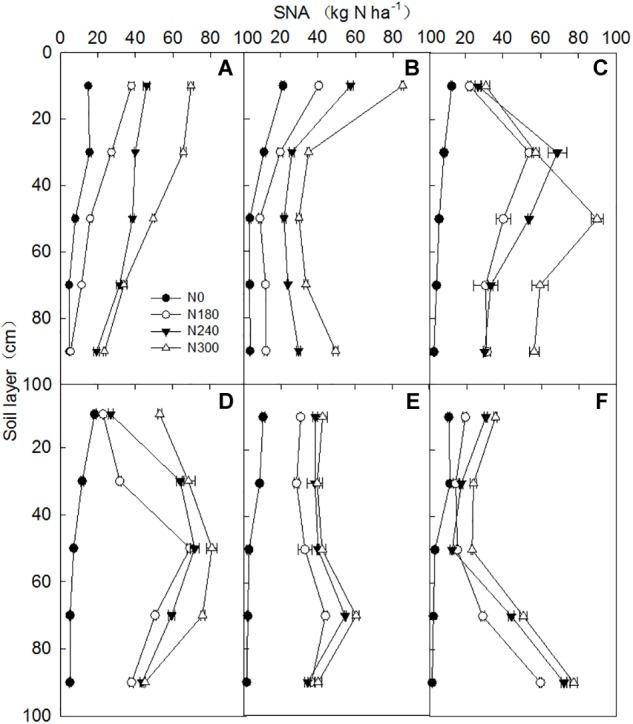
FIGURE 4.

Nitrate distribution in the 0–100 cm soil layers after the winter wheat harvest for plants grown under different N application rates during the harvest years 2011–2016 in Wenxian. Panels (A), (B), (C), (D), (E), and (F) show the nitrate distribution for the different N rates in 2011, 2012, 2013, 2014, 2015, and 2016, respectively. Horizontal bars represent the standard errors of the mean.
