FIGURE 5.

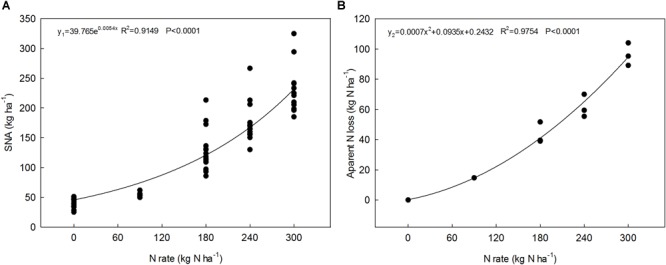
The relationships between SNA in the 0–100 cm soil layer (A) and apparent N loss (B) with N application rates across all experimental years and planting sites.

The relationships between SNA in the 0–100 cm soil layer (A) and apparent N loss (B) with N application rates across all experimental years and planting sites.