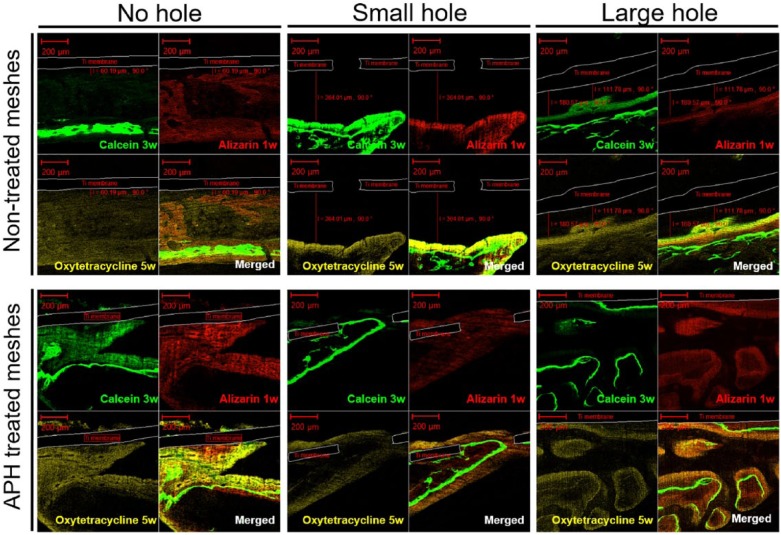
Figure 7.
Postoperative fluorescence microphotograph (magnification ×100) at 7 weeks: Alizarin labels at 1 week (red, right-above), Calcein labels at 3 weeks (green, left-above), Oxytetracycline labels at 5 weeks (yellow, left-below) and merged images.
The fluorescent images were taken around the center areas where new bone layer were found under Ti membranes.

