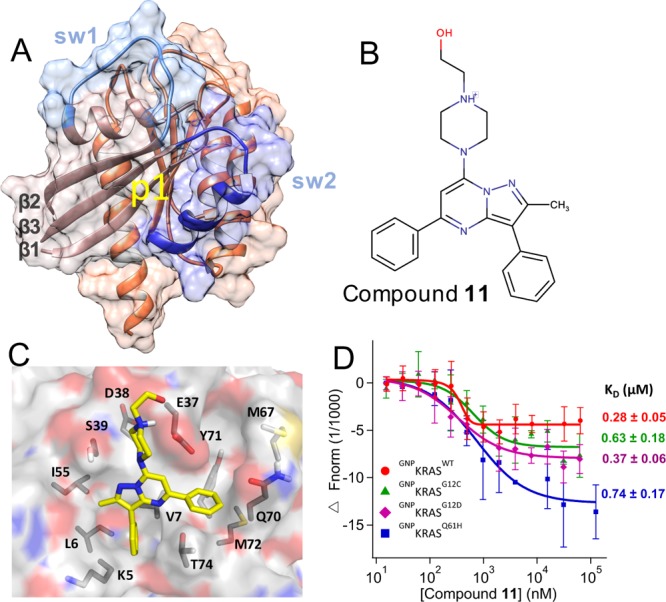
Figure 1.

Predicted binding mode and measured affinity of compound 11 to KRAS. (A) Structure of the catalytic domain of KRAS used for the virtual screening. Lobe1 (residues 1–86) and lobe2 (residues 87–166) are highlighted in different colors, as are switches 1 (residues 30–40) and 2 (residues 60–75). The location of our target allosteric pocket p1 is indicated. (B) Chemical structure of compound 11. (C) Predicted binding pose of compound 11, with the key residues that make polar or vdW contacts with the ligand labeled. (D) MST experiments indicating the direct binding of compound 11 to KRAS, along with dissociation constants (KD) derived from the curves. Changes in fluorescence upon titration of 50 nM KRAS with increasing concentration of compound are shown: KRASWT (red), KRASG12C (green), KRASG12D (purple), and KRASQ61H (blue), each bound to the nonhydrolyzable GTP analogue, guanylyl imidodiphosphate (GNP). No or very weak binding was detected toward GDP-bound KRAS, GNP- or GDP-bound NRAS and HRAS, and Rap1B that was used as control (Figure S3).
