Figure 2.

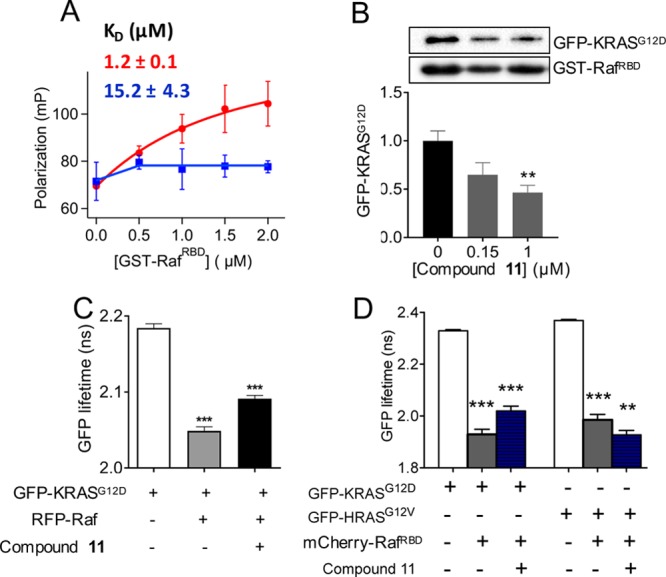
Compound 11 disrupts KRAS–Raf interaction.
(A) Fluorescence polarization of BGTP-γ-SKRAS (0.5 μM) as a function of varying concentration of GST–RafRBD in the absence (red) and presence (blue) of 1 μM
compound 11. Shown above the curves is the KD for KRAS–RafRBD binding obtained by
fitting the data to  , where P1 is
the polarization
of free KRAS, P2 is the polarization of Raf-bound
KRAS, c is the total concentration of KRAS, and x is the total concentration of RafRBD. (B) Amount
of GFP–KRASG12D pulled down by GST–RafRBD after treatment of cell lysates with compound at the indicated
concentrations (representative westerns shown at the top). An equal
volume of lysates was used, and the data were normalized to GST–RBD
and DMSO control, which also serves as the loading control. The RBD
sequence length was 1–149 and 51–131 in the fluorescence
polarization and pull-down assays, respectively. Whereas the shorter
RBD is sufficient for biochemical assays, the extra amino acids in
the longer RBD increases the size and thereby enhances the signal-to-noise
ratio in the fluorescence polarization assay. (C) GFP fluorescence
lifetime from FLIM–FRET using cells expressing GFP–KRASG12D alone or with RFP–Raf (full-length cRaf: residues
1–648), with or without treatment by 1 μM compound 11. (D) GFP fluorescence lifetime from FLIM–FRET using
cells expressing GFP–KRASG12D or HRASG12V with an empty vector pC1 or mCherry-RafRBD (RBD: residues
51–131), with or without treatment with 1 μM compound 11. In (B–D), data are shown as mean ± standard
error (SE) from three separate experiments; significance was estimated
by one-way analysis of variance (ANOVA) relative to the control for
each bar in B, second bar in C, and second and fourth bars in D, or
relative to the bar immediately to the left of bar 3 in C and bars
3 and 6 in D.
