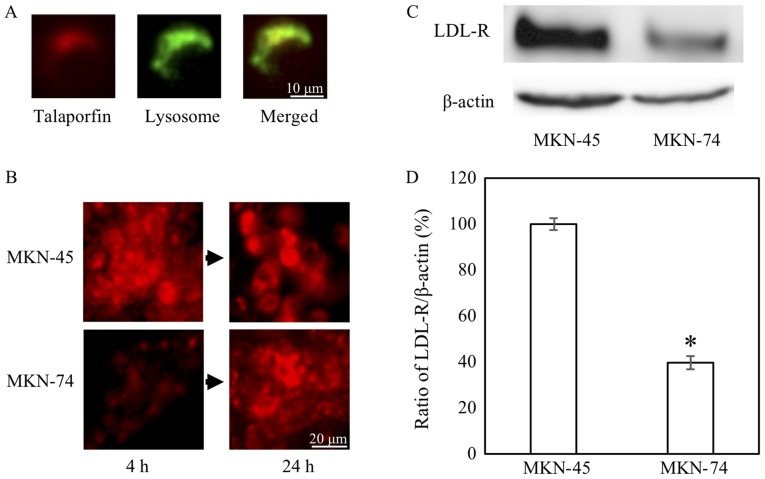
Figure 2.
Talaporfin sodium uptake and LDL receptor expression. (A and B) Lysosome was stained green and TS was red (Objective lens, ×10). (C and D) LDL receptor expression by western blotting and reverse transcription-quantitative polymerase chain reaction. *P<0.05 vs. MKN-45 (n=3). Error bar is expressed as standard error. LDL, low-density lipoprotein; TS, talaporfin sodium.

