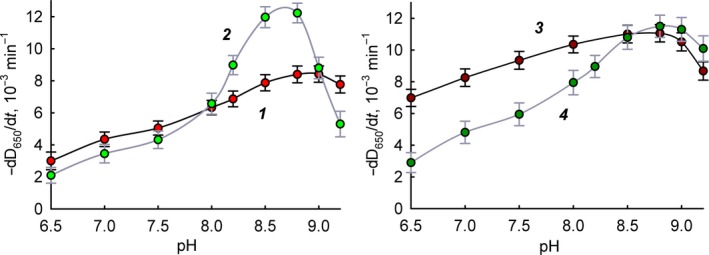
Figure 1.

The pH dependence of the lysis rate of bacteria in the presence of lysozyme. Experimental data are presented as mean and 95% confidence interval calculated by Student's t‐test, n = 5. 1: M. luteus in the presence of free lysozyme; 2: E. coli in the presence of free lysozyme; 3: M. luteus in the presence of immobilized lysozyme; 4: E. coli in the presence of immobilized lysozyme.
