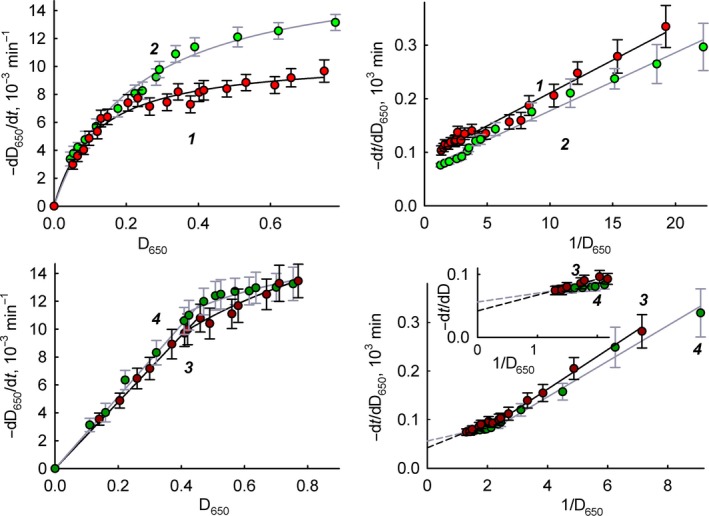
Figure 2.

The dependence of the lysis rate of bacteria in the presence of lysozyme on the concentration of bacteria in the direct and inverse coordinates. Experimental data are presented as mean and 95% confidence interval calculated by Student's t‐test, n = 5. 1: M. luteus in the presence of free lysozyme; 2: E. coli in the presence of free lysozyme; 3: M. luteus in the presence of immobilized lysozyme; 4: E. coli in the presence of immobilized lysozyme.
