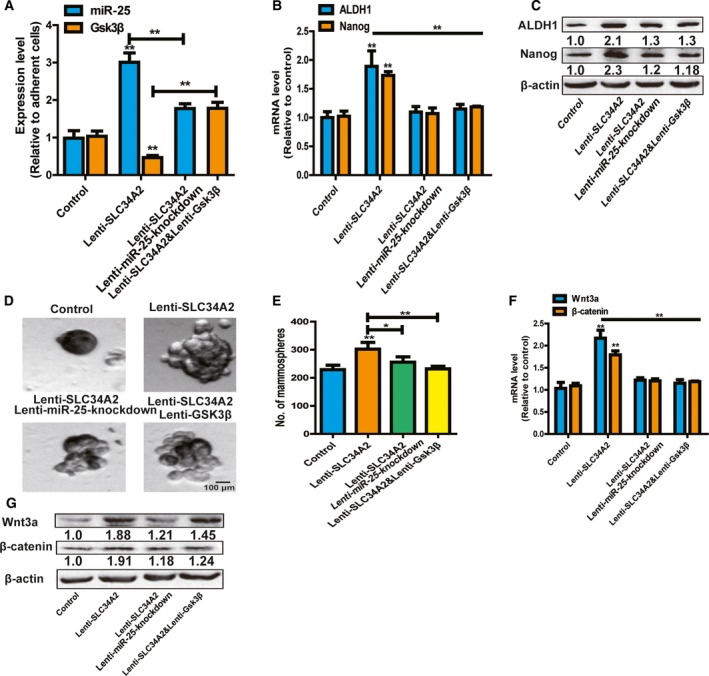
Figure 5.

SLC34A2 attenuates the stemness of neuroblastoma cells through miR‐25–Gsk3β axis. (A) MiR‐25 and Gsk3β expression was detected in SH‐SY5Y cells with SLC34A2 overexpression plus miR‐25 knockdown or Gsk3β overexpression. (B,C) Expressions of stemness markers were measured in cells depicted in (A). (D,E) The capacity of spheroid formation was determined in cells described in (A) by detecting the spheroid size (D) and number (E). Scale bar, 100 μm. (F,G) Expression of Wnt3a and β‐catenin was examined in cells depicted in (A). The difference was assayed using one‐way ANOVA with the Tukey–Kramer post hoc test. Data are presented as mean ± SD; n ≥ 3, *P < 0.05, **P < 0.01 vs control.
