
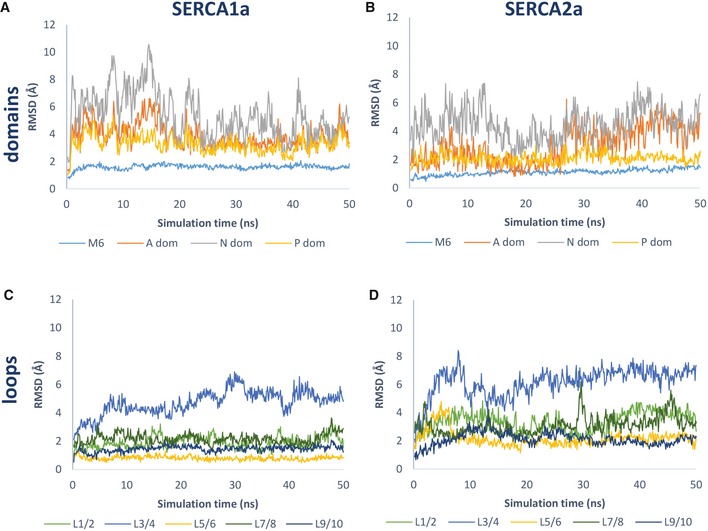
Figure 5. RMSD values of selected SERCA regions during the MD trajectory.
-
A, BRepresentative plot of one MD simulation depicting main chain RMSD values of M6 and A‐, N‐ and P‐domains in SERCA1a (A) and SERCA2a (B) over the course of the MD trajectory.
-
C, DRepresentative plot of one MD simulation depicting RMSD values of SERCA1a (C) and SERCA2a (D) luminal loops L1/2, L3/4, L5/6, L7/8, and L9/10 over the MD trajectory. Average RMSD values and statistical analysis are provided in Table 2. RMSD, root‐mean‐square deviation.