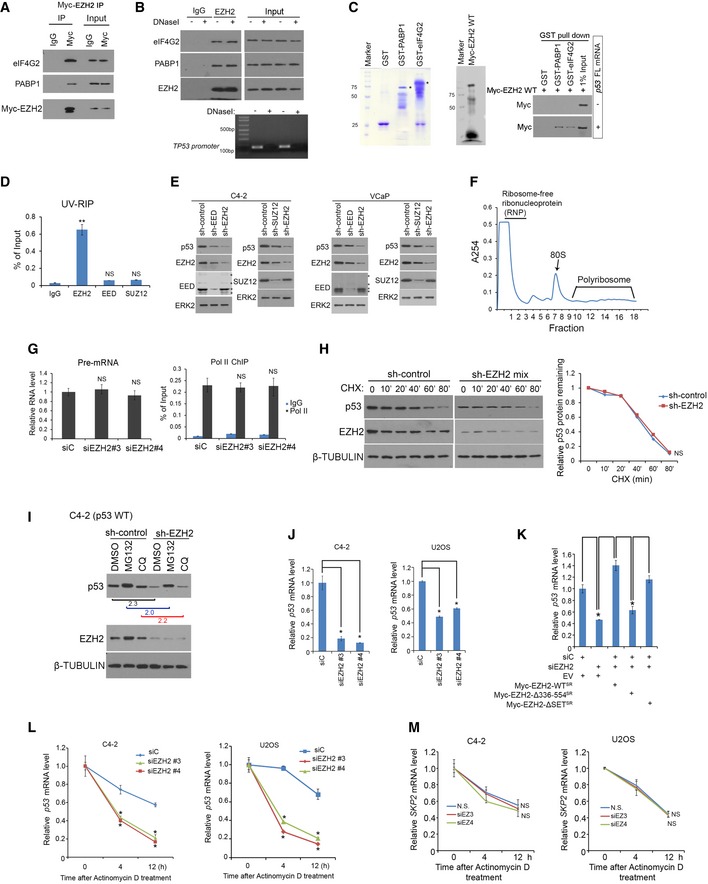
Figure EV3. The effect of the EZH2‐specific enzymatic inhibitor GSK126 on p53 mRNA expression and stability. Related to Fig 3 .

-
AC4‐2 cells transfected with Myc‐EZH2 WT for 24 h were lysed for co‐IP and Western blot analysis.
-
BC4‐2 cells were lysed in IP buffer and treated with DNaseI in 37°C for 15 min followed by co‐IP and Western blot analysis. Genomic DNA in input samples was assessed by PCR using primers for TP53 promoter.
-
CGST, GST‐eIF4G2, and GST‐PABP1 proteins were purified from BL21 bacteria. Myc‐EZH2 was produced using Quick coupled transcription/translation kit through T7 promoter in vitro. p53 full‐length (FL) mRNA was transcribed by T7 enzyme in vitro. These purified proteins were used for GST pull‐down assay in the presence or absence of p53 FL mRNA, followed by Western blot analysis.
-
DUV‐RIP‐qPCR analysis of p53 mRNA immunoprecipitated by IgG, anti‐EED, anti‐SUZ12, or anti‐EZH2 antibody from lysate of C4‐2 cells treated with 4SU for 8 h. Data shown are mean values ± SD from three replicates. **P < 0.01 comparing EZH2 IP with IgG IP. NS, no significance.
-
EC4‐2 (Left) and VCaP (Right) cells were infected with lentivirus for non‐specific control (sh‐Control) or two independent EED (or SUZ12)‐specific shRNAs for 48 h followed by Western blot analysis. ERK2, a loading control.
-
FRNA was extracted from sucrose gradient fractions of C4‐2 cell lysate. 40S, 60S, 80S, and polyribosomes were indicated above fraction numbers. A254, absorbance at 254 nm.
-
GC4‐2 cells were infected with lentivirus for si‐control or siEZH2#3 or siEZH2#4 for 48 h followed by RT–PCR analysis of p53 pre‐mRNA expression (Left) and ChIP‐PCR analysis of Pol II (N20) occupancy (Right).
-
HControl or EZH2 knockdown C4‐2 cells were treated with cycloheximide (CHX, 50 mg/ml) for different periods of time and harvested for Western blot analysis. β‐TUBULIN, a loading control.
-
IControl or EZH2 knockdown C4‐2 cells were treated with MG132 (20 mg/ml) or chloroquine (CQ 25 mg/ml) for 8 h followed by Western blot analysis. β‐TUBULIN, a loading control.
-
JExpression of p53 mRNA was measured by RT–qPCR in C4‐2 cells 48 h after transfection with non‐specific control (siC) or two independent EZH2‐specific siRNAs. GAPDH was used as internal control. Data shown are mean values ± SD from three replicates. *P < 0.01.
-
KExpression of p53 mRNA was measured by RT–qPCR in C4‐2 cells 48 h after transfection with non‐specific control (siC) or EZH2‐specific siRNAs in combination with or without empty vector (EV) or siRNA‐resistant Myc‐EZH2 wild‐type (WT) or mutants. GAPDH was used as an internal control. Data shown are mean values ± SD from three replicates. *P < 0.01.
-
L, Mp53 (L) and SKP2 (M) mRNA stability was assessed in C4‐2 and U2OS cells transfected with non‐specific siRNA (siC) or EZH2‐specific siRNA followed by actinomycin D treatment. GAPDH was used as internal control. Mean values ± SD from three replicates. *P < 0.01.
Source data are available online for this figure.
