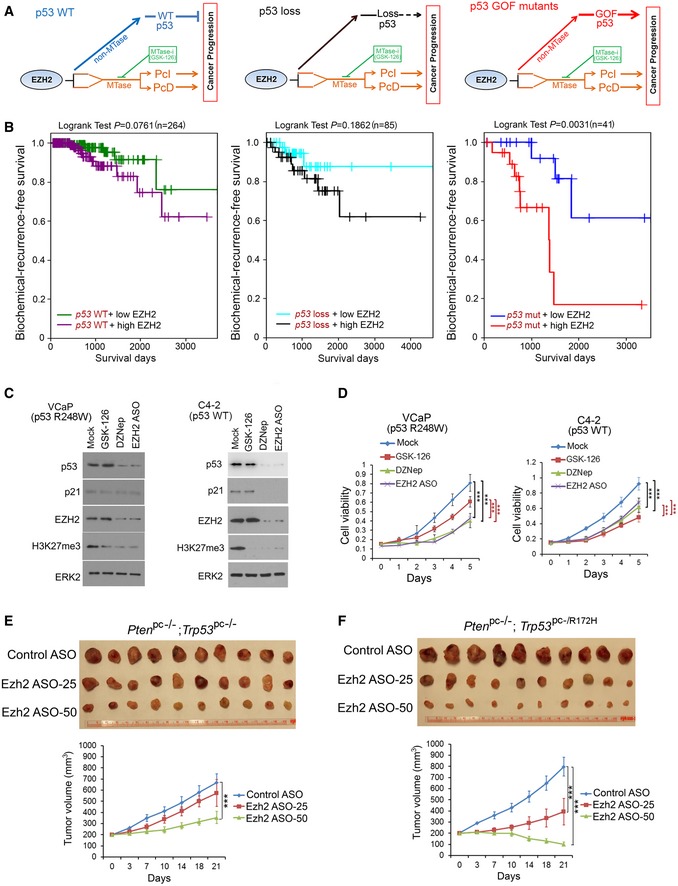
Figure 7. Depletion of EZH2 expression inhibits growth of p53 GOF‐mutated cancer cells.

-
ASchematic diagram depicting the distinctive impacts of the functional interplay between EZH2 protein and p53 mRNA on progression of cancers expressing WT p53, no p53, or GOF‐mutated p53. MTase, methyltransferase.
-
BKaplan–Meier plots showing the association of EZH2 overexpression with biochemical recurrence of prostate cancer in patients from the TCGA cohort. Tumors were separated into two groups according to EZH2 expression levels (high or low) and three groups based on the mutation status of p53 (WT, loss or mutated).
-
C, DVCaP and C4‐2 cells were treated with GSK‐126, DZNep (5 μM for VCaP and 10 μM for C4‐2), and EZH2 ASO, followed by Western blots with indicated antibodies (C) and MTT assay (D). Data shown as means ± SD (n = 6). Statistical significance was determined by two‐tailed Student's t‐test. ***P < 0.001.
-
E, FEffect of Ezh2 ASOs on growth of murine prostate cancer allografts. Mice (n = 10) bearing the Pten pc−/−;Trp53 pc−/− (E) and Pten pc−/−;Trp53 pc−/R172H allografts (F) were treated according the scheme shown in (Appendix Fig S2G) with control ASOs (50 mg/kg) or Ezh2 ASOs at different doses (25 and 50 mg/kg). Tumor growth was measured twice a week for 3 weeks, and the data are shown in the bottom panels. Each allograft was isolated by the end of ASO treatment and photographed (top panels). Data shown as means ± SD (n = 10). Statistical significance was determined by two‐tailed Student's t‐test. ***P < 0.001.
Source data are available online for this figure.
