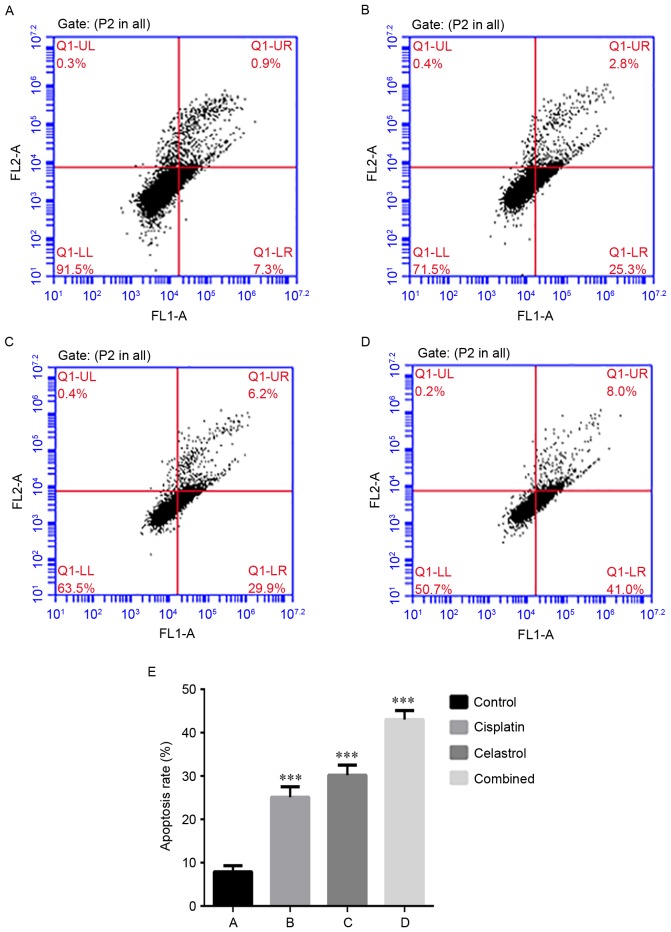
Figure 2.
Annexin V-FITC/PI staining assay. Representative graphs obtained by flow cytometric analysis following double-staining with Annexin V-FITC/PI. Compared with (A) the control cells (0 µM, 7.9±1.25%), the percentage of apoptotic U-2OS cells was increased to 28.5±0.9, 35.4±1.4 and 48.5±1.6% following treatment with (B) celastrol, (C) cisplatin and (D) celastrol combined with cisplatin for 48 h, respectively. (E) Quantification of parts A-D. Data are expressed as means ± standard deviation. ***P<0.001 vs. control (0 µM). FITC, fluorescein isothiocyanate; PI, propidium iodide.

