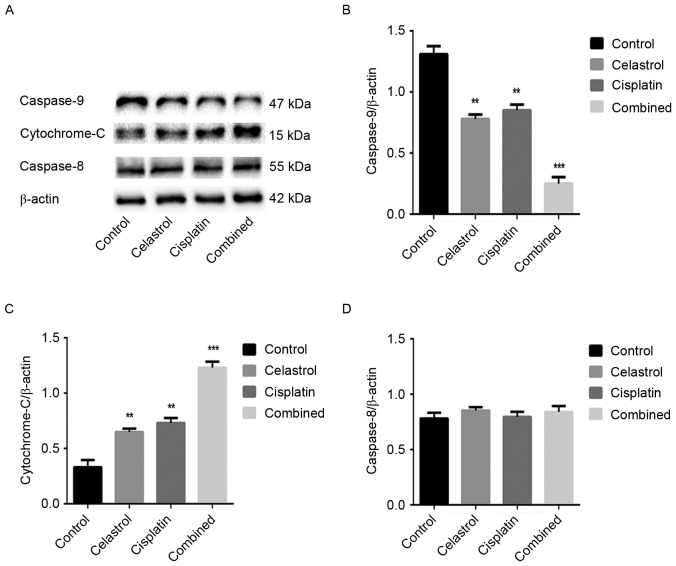
Figure 4.
Effect of celastrol and cisplatin on the protein expression levels of caspase-8, 9 and cytochrome c in U-2OS cells. (A) The protein expression levels of caspase-9, caspase-8 and cytochrome c were analyzed by western blot analysis. β-actin was used as the internal control for the western blot analysis. The quantified relative protein expression levels of (B) Caspase-9, (C) cytochrome c and (D) caspase-8 in celastrol/cisplatin-treated and control cells. The data are expressed as the mean ± standard deviation. **P<0.01, ***P<0.001 vs. control cells.

