Figure 4.
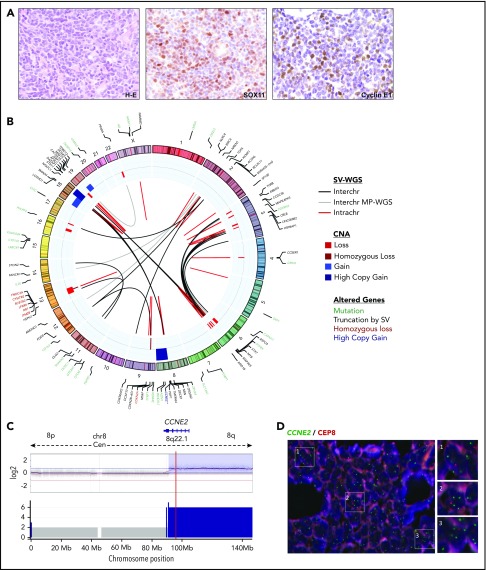
Comprehensive genetic characterization of an MCL−for CCND1, CCND2, and CCND3 (ID73). (A) Tumor cells from the skin lesion had a blastoid morphology (hematoxylin and eosin [H-E] stain; original magnification ×40), nuclear positivity for SOX11 (×40), and cyclin E1 (×40). (B) Circos plot representing, from inner to outer circles: SVs detected by WGS (black lines for interchromosomal and red for intrachromosomal rearrangements) or detected only by MP-WGS (gray lines); CNAs are represented in blue (gains and high copy gains) and red (losses and homozygous losses) palettes. In the outer circle are the genes altered by mutations (green), genes disrupted by SVs (black), genes affected by homozygous deletions (red), and the CCNE2 gene with high-level gain (dark blue). No rearrangements of any cyclin or immunoglobulin genes could be detected. There were 2 dense clusters of interchromosomal rearrangements: (i) 1 between chromosomes 3 and 6, at the regions of copy-number loss; and (ii) between chromosomes 8 and 18 at the regions of high copy gain. The gain of chromosome 19 and the loss of chromosome 22 were also supported as a reciprocal rearrangement by MP-WGS. The tumor purity of the case inferred by ASCAT was 78.2% and the ploidy 2.13 (diploid). (C) Chromosome 8 profile showing a partial 8q high-level gain (including the CCNE2 gene locus, indicated by the red line) by 2 different techniques; SNP6.0 copy-number arrays (top) and WGS analysis (bottom). (D) FISH with a locus-specific CCNE2 probe (green) and a centromeric chromosome 8 probe (orange) confirming that most tumors cells had at least 2 extra copies of the CCNE2 gene. Magnifications of 3 regions with the gain were shown at the right side (DAPI stain; original magnification ×100).

