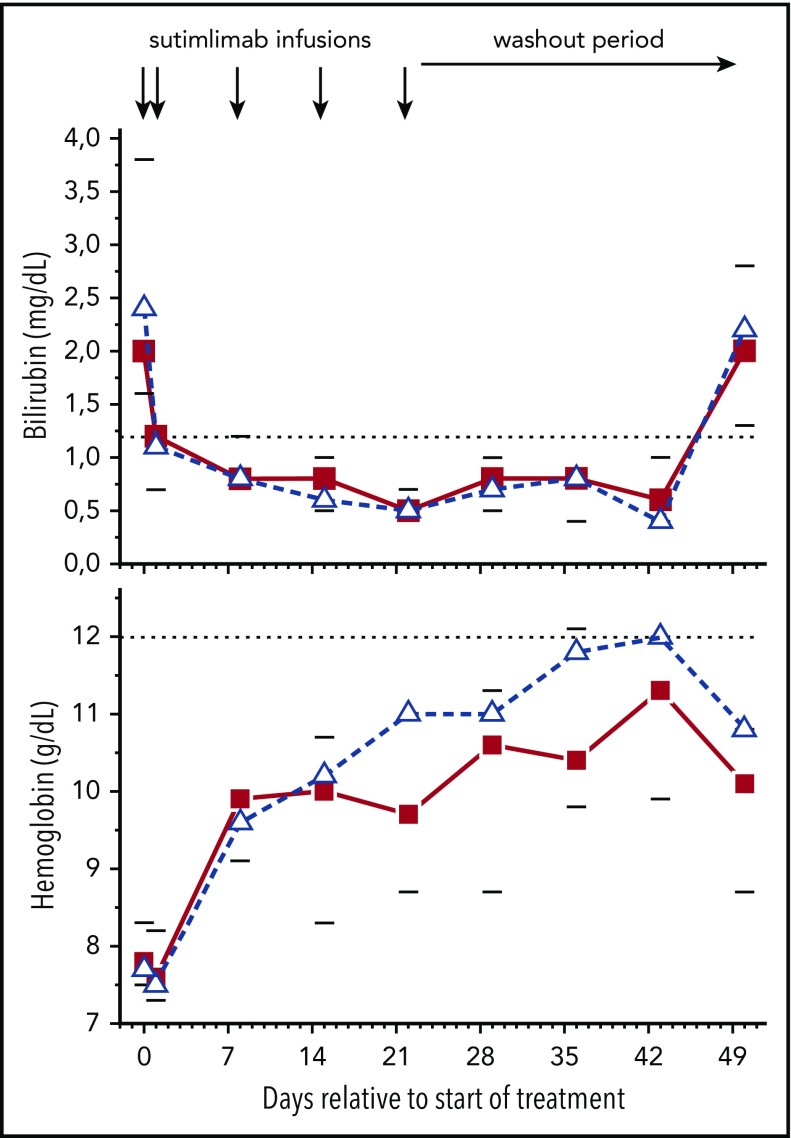
Figure 3.
Sutimlimab rapidly normalized bilirubin levels and increased hemoglobin levels. The horizontal dotted lines indicate normal limits. Data are presented as medians with 25th to 75th percentiles for 10 patients (solid squares). The open triangles represent the median levels in the subgroup of patients with no concurrent lymphoma or mixed AIHA (n = 6). Reciprocal changes in bilirubin and hemoglobin levels occurred after effective drug levels washed out.

