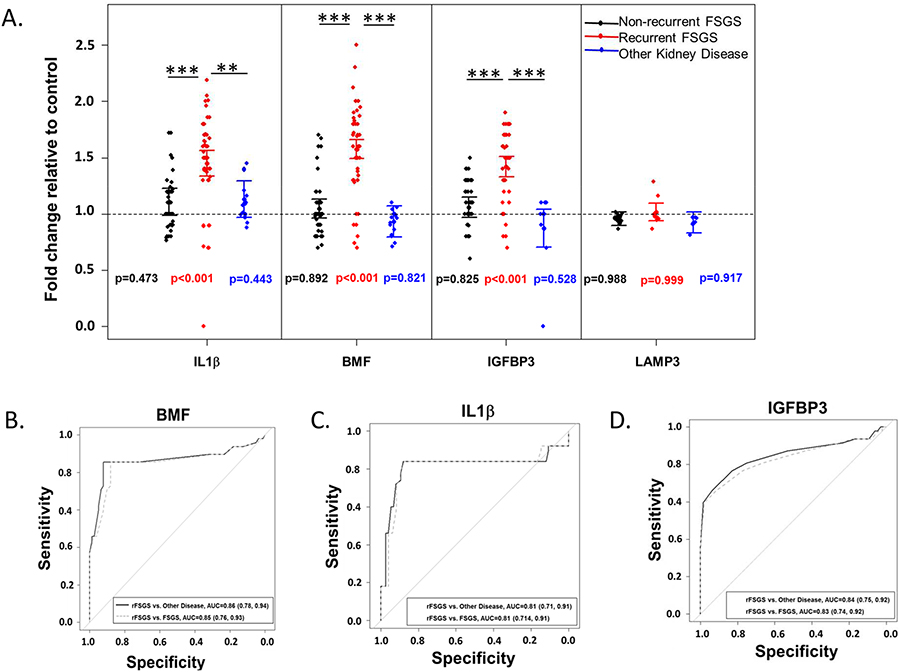
Figure 3: The BMF, IL1β and IGFBP3 reporter cell lines detect rFSGS patients with high specificity:
(A) To evaluate the specificity of this assay, differences in mean fold-change response from BMF, IL1β and IGFBP3 cell lines between rFSGS patient samples and other nephropathies were statistically analyzed after pooling the data and were categorized into three groups (Black, FSGS; Red, rFSGS and Blue, MGN/MG/Control plasma). The fold change for BMF, IL1β and IGFBP3 promoter cell lines treated with rFSGS plasma were significantly higher when compared to non-rFSGS/MGN patient plasma. Points are values averaged within subject for each group and the lines represent the 95% confidence interval for mean FC. The horizontal dashed line represents 1-fold change (control). P-values beside the points for each group represent the p-value for comparison to control. Significant differences for pairwise group comparisons are signified by the vertical lines where * is p<0.05, ** is p < 0.01, and *** is p < 0.001. All p-values are corrected for multiple comparisons using Tukey’s honestly significant difference. In contrast, no significant change in the expression of LAMP3 relative in rFSGS samples vs other kidney diseases were observed (p=0.999). Additionally, no differences were observed between samples from patients with FSGS or other nephropathies in this cell line. (B-D) To further evaluate the discriminative performance for each promoter, sensitivity and specificty values for IL1β, BMF, and IGFBP3 promoter cell lines were estimated using receiver operator characteristic curves. The AUCs for model fits discriminating between rFSGS and all other nephropathies and between rFSGS and non-recurrent FSGS ranged from 0.81 to 0.86 respectively, for IL1β and BMF reporter cell lines, whereas these were slightly lower for the IGFBP3 cell line (70% and 64% respectively). AUC, area under the curve.

