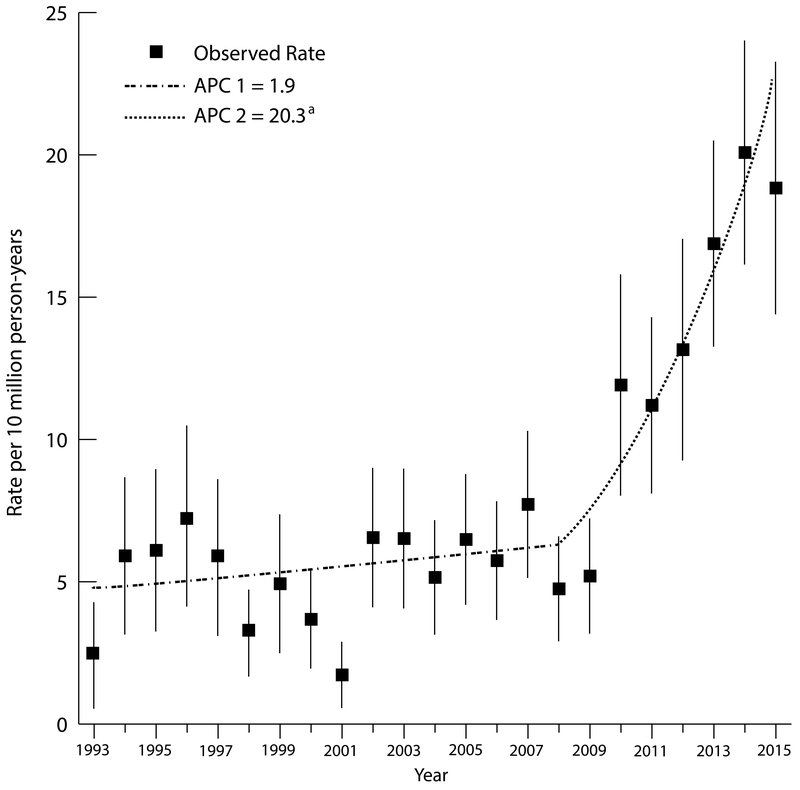
Figure 1. Rates of Hospitalization for Stroke Associated with Infective Endocarditis and Opioid Use, 1993-2015.
Segments indicate log-linear regression estimates for epochs described by different trends as detected by joinpoint regression. APC indicates annual percentage change for each segment. aIndicates that the APC was significantly different from zero. The error bars correspond to 95% confidence intervals for each of the observed annual rates.

