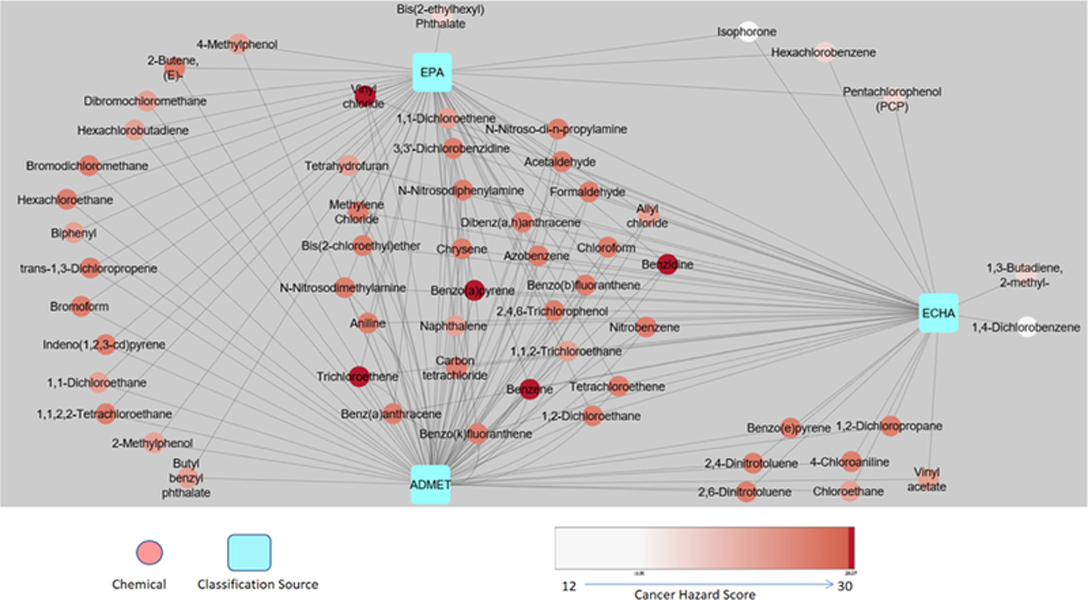
Fig. 3. Visualization of carcinogenic chemicals by Cytoscape.

The three sources, ADMET (ADMET Predictor™ computational predictions), EPA and ECHA, were linked by lines based on classification similarity. The node color intensity shows the cancer hazard score between 12 and 30 where chemicals with the highest color intensity are due to higher scores.
