Abstract
Characterization of the conformational ensemble of disordered proteins is highly important for understanding protein folding and aggregation mechanisms, but remains a computational and experimental challenge due to the dynamic nature of these proteins. New observables that can provide unique insights into transient residual structures in disordered proteins are needed. Here using denatured ubiquitin as a model system, we show that NMR solvent paramagnetic relaxation enhancement (sPRE) measurements provide an accurate and highly sensitive probe for detecting low populations of residual structure in a disordered protein. Further, we present a new ensemble calculation approach based on sPRE restraints in conjunction with residual dipolar couplings (RDCs) and small angle X-ray scattering (SAXS) to define the conformational ensemble of disordered proteins at atomic resolution. The approach presented here should be applicable to a wide range of dynamic macromolecules.
Keywords: NMR spectroscopy, intrinsically disordered proteins, paramagnetic relaxation enhancement, protein dynamics, ensemble calculation
Graphical Abstract
Making sense out of disorder: A novel approach based on NMR paramagnetic relaxation enhancement from a soluble paramagnetic agent provides insights into the conformations of disordered proteins. Residues in the protein that form residual structures are less exposed to the solvent and give rise to low paramagnetic relaxation enhancements.
Intrinsically disordered proteins (IDPs) and disordered protein regions play a crucial role in a variety of biological processes and are implicated in a number of human diseases such as Alzheimer’s, Parkinson’s and cancer.[1] They are highly abundant in nature and their levels typically increase with the organisms’ complexity. It is estimated that more than 30% of eukaryotic proteins contain large disordered segments.[2] Because of their flexibility, disordered proteins sample a large number of conformations and can interact with multiple targets, forming dynamic regulatory networks. Moreover, post-translational modifications and alternative splicing add to the diversity of their interactions and functions.[3] Characterizing the structural properties of this class of proteins is, therefore, essential for understanding mechanisms of IDP function, protein folding, misfolding and aggregation. However, this task is quite challenging due to the enormous number of conformations that disordered proteins adopt and the paucity of observables describing them.[4]
There is increasing experimental evidence that disordered proteins (IDPs and chemically denatured proteins) can display non-random-coil features in the form of transient “residual” structures.[5] NMR spectroscopy is the key method for characterizing these structures at atomic resolution and several types of data, in particular residual dipolar couplings (RDCs)[5e–g] and paramagnetic relaxation enhancements (PREs),[5e, 6] have provided important insights. However, for a detailed description of the conformational ensemble of disordered states, additional observables that can provide complementary and independent structural information are needed.
PRE is based on the dipolar interaction between the nucleus of interest and unpaired electron(s) of a paramagnetic center with an r−6 distance-dependence. Due to the large magnetic moment of electrons, PRE is a highly sensitive method for detecting sparsely-populated conformations.[7] Typically, the paramagnetic center is incorporated by site-directed spin-labeling of the protein, which often also involves mutagenesis for introducing single cysteines. However, attachment of a spin-label (such as MTSL) to a disordered protein can, potentially, lead to artificial intramolecular interactions and perturb the populations in the ensemble, as shown recently for the amyloid-β peptide (Aβ) both by NMR[8] and computational studies.[9] Alternatively, PREs can be obtained from soluble paramagnetic probes: a method referred to as cosolute or solvent PRE (sPRE) that reports on the solvent accessibility of an atom.[10] In contrast to PRE obtained from covalently-attached spin-labels, sPRE is measured without modifying the molecule under study and is therefore readily accessible. In addition to being a label-free measurement, sPRE has the advantage that the relaxation rate enhancement can be tuned by the concentration of the paramagnetic probe added to the sample. Given these advantages and the fact that disordered proteins have large surface areas,[11] we reasoned that the solvent accessibility information provided by sPRE would be a highly suitable NMR observable for characterizing the conformation of residual structures in disordered proteins.
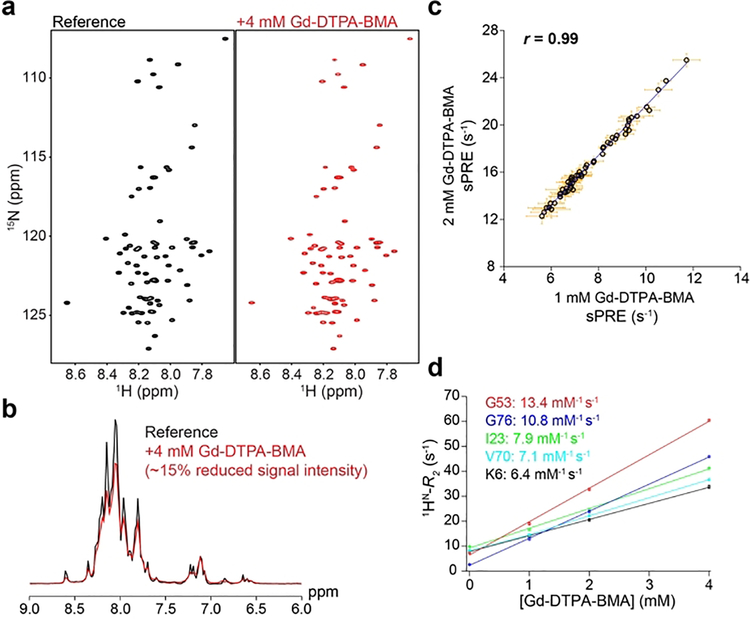
Previously, sPRE has been applied to studying of folded proteins,[12] large protein complexes[13] and RNA.[14] To test the suitability of the sPRE experiment for probing the conformational ensemble of disordered proteins, we used urea-denatured ubiquitin, a model system that has been studied extensively by NMR,[15] Förster resonance energy transfer (FRET),[16] small angle X-ray scattering (SAXS)[17] and molecular dynamics (MD) simulations.[18] We measured transverse amide proton sPRE rates (1HN-Γ2) on urea-denatured ubiquitin in the presence of increasing amounts of the paramagnetic probe Gd-diethylenetriamine pentaacetic acid-bismethylamide (Gd-DTPA-BMA) up to 4 mM concentration (Figure 1a). Gd-DTPA-BMA is an MRI contrast agent with high water-solubility and no net charge, thus well-suited for sPRE measurements.[12a] Due to favorable relaxation properties of disordered proteins, even at 4 mM concentration of the paramagnetic probe, corresponding to more than 10-fold excess over the protein concentration, there is only a small (~15%) reduction in the overall signal intensity (Figure 1b).
Figure 1.
sPRE studies on denatured ubiquitin. a) 1H, 15N HSQC spectra of ubiquitin denatured in 8 M urea at pH 2.5 in the absence (left, black) and presence (right, red) of 4 mM Gd-DTPA-BMA. b) Overlay of 1D projections of the spectra shown in panel a. c) Correlation of sPRE data measured in the presence of 1 mM and 2 mM Gd-DTPA-BMA. The correlation coefficient (r) is shown. d) Transverse proton relaxation rates (1HN-R2) plotted against Gd-DTPA-BMA concentrations for selected residues in urea-denatured ubiquitin. The plot shows that the change in relaxation rate as a function of paramagnetic probe concentration is linear. The slope of this line corresponds to the relaxivity for each residue (in units of mM−1s−1), which is defined as the change in relaxation rate normalized to the probe concentration.
The high quality of the spectra allows accurate measurement of sPRE rates (Supporting Information). Importantly, there are no detectable 1H and 15N chemical shift changes between the paramagnetic and reference spectra (Figure 1a, b), indicating that the probe does not form a specific complex with the protein, but is likely homogenously distributed around it. This is further confirmed by noting that the sPRE measured at two concentrations of the paramagnetic probe are highly correlated (correlation coefficient r = 0.99) and consequently the increase in relaxation rates with increasing probe concentration is linear (Figure 1c, d).
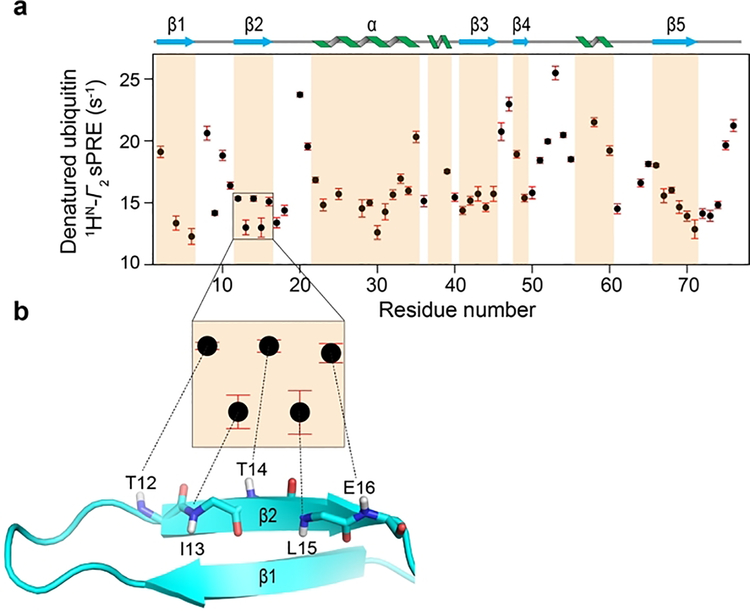
The sPRE data of denatured ubiquitin display differential solvent accessibilities in a residue-specific manner (Figure 1d). Indeed, the lowest and highest sPRE rates in the protein differ by more than two-fold: at 2 mM concentration of the probe, sPRE ranges from ~12 s−1 to ~26 s−1 (Figure 2a). The large variation along the protein sequence illustrates that sPRE rates are rich in structural information about the disordered ensemble.
Figure 2.
sPRE reveals native-like structure in denatured ubiquitin. a) Transverse amide proton sPRE rates (1HN-Γ2) of urea-denatured ubiquitin obtained in the presence of 2 mM Gd-DTPA-BMA plotted against the residue number. Secondary structure elements of native ubiquitin are shown above the plot and the corresponding regions are shaded. b) The zoomed-in view shows sPRE data points for residues T12-E16 (with the sequence TITLE) that correspond to a β-hairpin in native ubiquitin (PDB: 1D3Z, shown as cartoon). Amide protons of residues in the β2 strand that are involved in hydrogen-bonding with the opposite strand display lower sPRE values than neighboring residues. Backbone atoms in the β2 strand are shown as sticks with C, H, N and O colored as cyan, gray, blue and red, respectively.
Interestingly, the variation in the sPRE data seems to correlate with the secondary structures observed in the natively folded ubiquitin, i.e. residues in the loops, generally, exhibit higher sPRE rates than those in the α/β regions (Figure 2a). To further assess the similarity of denatured and native ubiquitin, we compared the experimental sPRE data of the two states (Supporting Information Figure S1). The comparison shows that, as a function of sequence, there is less variation in the sPRE and thus solvent accessibility in the denatured relative to the native state, which is expected given their unfolded and folded conformations, respectively. Surprisingly, however, the sPRE patterns of the two states show considerable similarity, particularly in the first 35 residues, indicating that there is significant amount of residual native-like structure in the denatured protein (Supporting Information Figure S1). Notably, residues 12–16 (with the sequence: TITLE) in denatured ubiquitin display an alternate high-low sPRE pattern where T12, T14 and E16 have higher solvent accessibilities than I13 and L15, resembling the alternate hydrogen-bonding pattern of amide groups seen in this region (β2 strand) of the native ubiquitin structure (Figure 2b). This is consistent with previous studies based on long-range proton RDCs and J-couplings that have reported residual β-hairpin structure in this region of urea-denatured ubiquitin.[15b, 15c] In addition, the sPRE pattern corresponding to the α-helix (residues 22–35) coincides with the pattern observed in native ubiquitin (Supporting Information Figure S1). In summary, our sPRE analysis reveal that despite being unfolded, there is significant amount of native and non-native structure in urea-denatured ubiquitin. Thus, sPRE data are highly sensitive to low populations of residual structure in disordered proteins.
To interpret the sPRE data in a quantitative way, we have developed a new sPRE module and energy potential (PSolPot) that is implemented in the structure calculation program Xplor-NIH.[19] The PSolPot module enables calculation of sPREs from an ensemble of structures; the sPREs back-calculated from the native ubiquitin structure (PDB:1D3Z[20]) show an excellent agreement to previously published experimental data[12b] (correlation coefficient r = 0.95 and sPRE Q-factor = 0.17), confirming the accuracy of the approach (Supporting Information Figure S2). In addition, PSolPot has several features that enable ensemble calculations of dynamic systems based on sPRE data. First, it allows the direct use of sPRE as a restraint in simulated annealing calculations combined with other observables such as PRE, RDC and SAXS. Second, it is computationally efficient, an important attribute in the case of disordered proteins where thousands of structures need to be calculated for extracting statistically significant information. Finally, it offers ensemble-averaging where the sPRE for each member of the ensemble is calculated and averaged. The “ensemble” feature is essential for describing dynamic systems such as disordered proteins (Supporting Information).
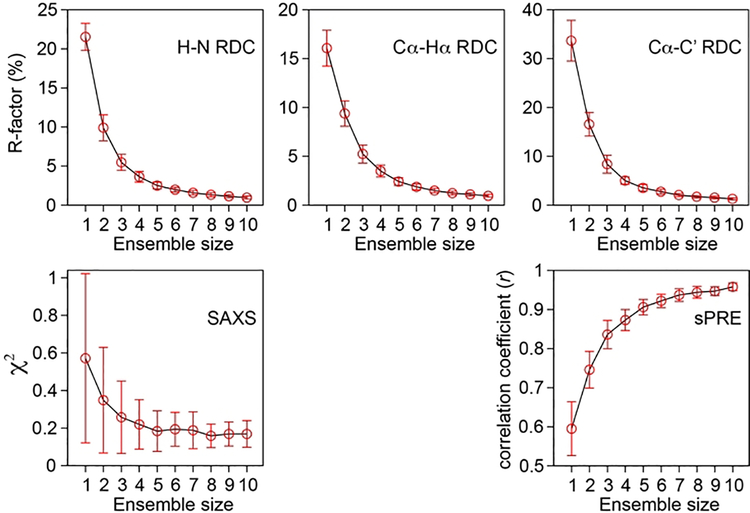
To assess the conformations of residual structures present in denatured ubiquitin, it would be very informative to extract the structural information provided by sPRE by calculating an ensemble of structures that are in agreement with the experimental data. Previously, Grzesiek et al. have characterized the conformational ensemble of urea-denatured ubiquitin by using an extensive array of NMR restraints including 253 PREs (from eight MTSL-tagged samples) and 419 RDCs (nine sets).[15d, 16] As a proof of principle and to demonstrate that sPRE-derived restraints can be integrated into structure calculations of disordered proteins, we carried out calculations of denatured ubiquitin using a relatively limited set of restraints comprising three sets of RDCs (H-N, Cα-Hα and Cα-C’),[15b] SAXS[17] and sPRE. A single conformer representation (ensemble size = 1) fits poorly to the experimental data, but by increasing the ensemble size the fit improves dramatically and converges at ~5 (Figure 3). Note that a similar ensemble size was required for fitting a much larger dataset of RDC and PRE restraints.[15d] With an ensemble size of 5 (equally weighted members) there is an excellent agreement between experimental and calculated sPRE (correlation coefficient r > 0.9) and equally good fits to the RDC and SAXS data within experimental error (Figure 3).
Figure 3.
Convergence of the fit to experimental data by the increase in ensemble size. Data were obtained by simulated annealing calculations of denatured ubiquitin at different ensemble sizes using three sets of RDCs (H-N, Cα-Hα, Cα-C’), sPRE and SAXS data as structural restraints. An ensemble size of ~5 (equally weighted members) is sufficient to satisfy all experimental data within experimental error.
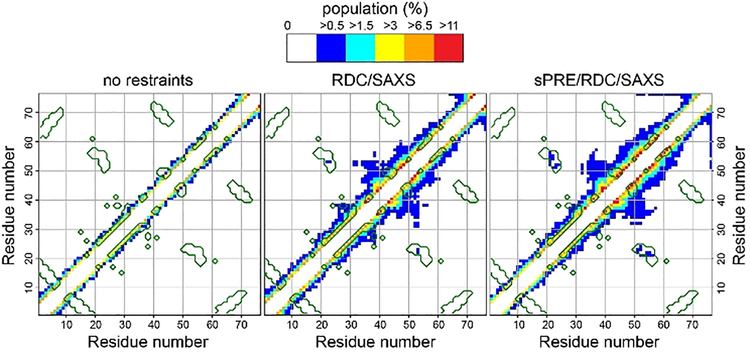
We next compared the ensembles calculated without and with sPRE/RDC/SAXS restraints. In each case we calculated 10,000 conformers (2,000 structures with an ensemble size of 5) and analyzed the ensembles in terms of Cα-Cα contact maps. The analysis shows that the population of intramolecular contacts in the “restrained” ensemble is significantly enhanced compared to the “unrestrained” one (Figure 4).
Figure 4.
Cα-Cα contact maps of urea-denatured ubiquitin from an ensemble of 10,000 conformers (2000 structures with an ensemble size of 5) obtained from Xplor-NIH simulated annealing calculations without experimental restraints (left), with RDC/SAXS (middle) and sPRE/RDC/SAXS (right) restraints. Contacts are color-coded according to contact population (probability), defined as the total number of Cα-Cα contacts within 8 Å distance cut-off divided by the total number of conformers. Native contacts, i.e. observed in the NMR structure of ubiquitin (PDB: 1D3Z), are enclosed by green lines. For clarity, only contacts between residues more than 3 residues apart (|i-j|>3) are shown.
In particular, there are many i→i+4 Cα-Cα contacts, some of which are the same as in the native ubiquitin structure (native contacts are encircled by green lines in Figure 4). These contacts involve a fragment corresponding to the α-helix in native ubiquitin (residues 22–35) and also throughout the C-terminal half of the protein including the region around residues 40–60 that show contact populations as high as 16%. In addition, there are a large number of longer range non-native contacts at lower populations, for example in the middle portion and C-terminus of the protein. However, the most notable feature is a cluster of long-range native contacts at the level of ~0.5% between residues 21–24 and 51–56 that corresponds to the interaction of the N-terminus of the α-helix and a nearby loop in the ubiquitin structure (Figure 4). Overall, many features of the denatured ubiquitin structural ensemble calculated using a combination of sPRE/RDC/SAXS restraints are similar to the ensemble calculated previously based on a much larger set of experimental restraints.[15d, 16] Collectively, our results strongly support the idea that despite being unfolded, certain characteristics of the natively folded protein are retained in urea-denatured ubiquitin.
To specifically evaluate the information content of the sPRE data, we compared the contact map of the ensemble described above calculated using sPRE/RDC/SAXS restraints with that of an ensemble calculated using only RDC/SAXS restraints (Figure 4). The comparison reveals that addition of the sPRE restraints results in an enhanced population of Cα-Cα contacts in the region around residues 40–60. Most notably, the number of long-range native-contacts involving residues 21–24 and 51–56 is increased by addition of the sPRE restraints (Figure 4). This demonstrates that sPRE restraints provide unique structural information and highlights the importance of using a combination of experimental data to characterize the conformational ensemble of disordered proteins.
In conclusion, we show that the solvent accessibility information obtained from sPRE is a readily accessible NMR observable that is highly sensitive to low populations of residual structure in disordered proteins. Further, the ensemble calculation approach presented here allows direct refinement against sPRE restraints in a computationally-efficient manner. This enables combining sPRE with other experimental data such as RDC and SAXS to provide a quantitative description of the conformational ensemble of disordered proteins at atomic resolution. We anticipate that sPRE will be an important addition to the NMR toolbox for studying disordered proteins.
Supplementary Material
Acknowledgements
We are grateful to Tobias Madl for providing the native ubiquitin sPRE data and Frank Gabel for providing the SAXS data. We would like to thank Stephan Grzesiek for discussions. HK acknowledges support from the NIH Lenfant Biomedical Fellowship. This work used the computational resources of the NIH HPC Biowulf cluster (http://hpc.nih.gov). This work was supported by NIH Intramural Research Programs of NHLBI and CIT.
Footnotes
Supporting information for this article is given via a link at the end of the document.
References
- [1]. a) Uversky VN, Oldfield CJ, Dunker AK, Annu Rev Biophys 2008, 37, 215–246; [DOI] [PubMed] [Google Scholar]; b) van der Lee R, Buljan M, Lang B, Weatheritt RJ, Daughdrill GW, Dunker AK, Fuxreiter M, Gough J, Gsponer J, Jones DT, Kim PM, Kriwacki RW, Oldfield CJ, Pappu RV, Tompa P, Uversky VN, Wright PE, Babu MM, Chem Rev 2014, 114, 6589–6631. [DOI] [PMC free article] [PubMed] [Google Scholar]
- [2].Oldfield CJ, Dunker AK, Annu Rev Biochem 2014, 83, 553–584. [DOI] [PubMed] [Google Scholar]
- [3]. a) Habchi J, Tompa P, Longhi S, Uversky VN, Chem Rev 2014, 114, 6561–6588; [DOI] [PubMed] [Google Scholar]; b) Wright PE, Dyson HJ, Nat Rev Mol Cell Biol 2015, 16, 18–29. [DOI] [PMC free article] [PubMed] [Google Scholar]
- [4].Mittag T, Forman-Kay JD, Curr Opin Struct Biol 2007, 17, 3–14. [DOI] [PubMed] [Google Scholar]
- [5]. a) Neri D, Billeter M, Wider G, Wuthrich K, Science 1992, 257, 1559–1563; [DOI] [PubMed] [Google Scholar]; b) Gillespie JR, Shortle D, J Mol Biol 1997, 268, 170–184; [DOI] [PubMed] [Google Scholar]; c) Shortle D, Ackerman MS, Science 2001, 293, 487–489; [DOI] [PubMed] [Google Scholar]; d) Klein-Seetharaman J, Oikawa M, Grimshaw SB, Wirmer J, Duchardt E, Ueda T, Imoto T, Smith LJ, Dobson CM, Schwalbe H, Science 2002, 295, 1719–1722; [DOI] [PubMed] [Google Scholar]; e) Dedmon MM, Lindorff-Larsen K, Christodoulou J, Vendruscolo M, Dobson CM, J Am Chem Soc 2005, 127, 476–477; [DOI] [PubMed] [Google Scholar]; f) Bernado P, Bertoncini CW, Griesinger C, Zweckstetter M, Blackledge M, J Am Chem Soc 2005, 127, 17968–17969; [DOI] [PubMed] [Google Scholar]; g) Bertoncini CW, Jung YS, Fernandez CO, Hoyer W, Griesinger C, Jovin TM, Zweckstetter M, Proc Natl Acad Sci U S A 2005, 102, 1430–1435; [DOI] [PMC free article] [PubMed] [Google Scholar]; h) Sung YH, Eliezer D, J Mol Biol 2007, 372, 689–707; [DOI] [PMC free article] [PubMed] [Google Scholar]; i) Salmon L, Nodet G, Ozenne V, Yin G, Jensen MR, Zweckstetter M, Blackledge M, J Am Chem Soc 2010, 132, 8407–8418. [DOI] [PubMed] [Google Scholar]
- [6]. a) Gillespie JR, Shortle D, J Mol Biol 1997, 268, 158–169; [DOI] [PubMed] [Google Scholar]; b) Xue Y, Podkorytov IS, Rao DK, Benjamin N, Sun H, Skrynnikov NR, Protein Sci 2009, 18, 1401–1424; [DOI] [PMC free article] [PubMed] [Google Scholar]; c) Wu KP, Baum J, J Am Chem Soc 2010, 132, 5546–5547. [DOI] [PMC free article] [PubMed] [Google Scholar]
- [7].Clore GM, Iwahara J, Chemical Reviews 2009, 109, 4108–4139. [DOI] [PMC free article] [PubMed] [Google Scholar]
- [8].Newby FN, De Simone A, Yagi-Utsumi M, Salvatella X, Dobson CM, Vendruscolo M, Biochemistry 2015, 54, 6876–6886. [DOI] [PubMed] [Google Scholar]
- [9].Sasmal S, Lincoff J, Head-Gordon T, Biophys J 2017, 113, 1002–1011. [DOI] [PMC free article] [PubMed] [Google Scholar]
- [10]. a) Bernini A, Venditti V, Spiga O, Niccolai N, Progress in Nuclear Magnetic Resonance Spectroscopy 2009, 54, 278–289; [Google Scholar]; b) Hocking HG, Zangger K, Madl T, Chemphyschem 2013, 14, 3082–3094. [DOI] [PMC free article] [PubMed] [Google Scholar]
- [11].Gunasekaran K, Tsai CJ, Kumar S, Zanuy D, Nussinov R, Trends Biochem Sci 2003, 28, 81–85. [DOI] [PubMed] [Google Scholar]
- [12]. a) Pintacuda G, Otting G, J Am Chem Soc 2002, 124, 372–373; [DOI] [PubMed] [Google Scholar]; b) Madl T, Bermel W, Zangger K, Angewandte Chemie 2009, 48, 8259–8262. [DOI] [PubMed] [Google Scholar]
- [13].Madl T, Guttler T, Gorlich D, Sattler M, Angewandte Chemie 2011, 50, 3993–3997. [DOI] [PubMed] [Google Scholar]
- [14]. a) Venditti V, Niccolai N, Butcher SE, Nucleic Acids Res 2008, 36, e20; [DOI] [PMC free article] [PubMed] [Google Scholar]; b) Hartlmuller C, Gunther JC, Wolter AC, Wohnert J, Sattler M, Madl T, Sci Rep 2017, 7, 5393. [DOI] [PMC free article] [PubMed] [Google Scholar]
- [15]. a) Wirmer J, Peti W, Schwalbe H, J Biomol NMR 2006, 35, 175–186; [DOI] [PubMed] [Google Scholar]; b) Meier S, Grzesiek S, Blackledge M, J Am Chem Soc 2007, 129, 9799–9807; [DOI] [PubMed] [Google Scholar]; c) Meier S, Strohmeier M, Blackledge M, Grzesiek S, J Am Chem Soc 2007, 129, 754–755; [DOI] [PubMed] [Google Scholar]; d) Huang JR, Grzesiek S, J Am Chem Soc 2010, 132, 694–705; [DOI] [PubMed] [Google Scholar]; e) Huang JR, Gabel F, Jensen MR, Grzesiek S, Blackledge M, J Am Chem Soc 2012, 134, 4429–4436. [DOI] [PubMed] [Google Scholar]
- [16].Aznauryan M, Delgado L, Soranno A, Nettels D, Huang JR, Labhardt AM, Grzesiek S, Schuler B, Proc Natl Acad Sci U S A 2016, 113, E5389–5398. [DOI] [PMC free article] [PubMed] [Google Scholar]
- [17].Gabel F, Jensen MR, Zaccai G, Blackledge M, J Am Chem Soc 2009, 131, 8769–8771. [DOI] [PubMed] [Google Scholar]
- [18].Xue Y, Skrynnikov NR, J Am Chem Soc 2011, 133, 14614–14628. [DOI] [PubMed] [Google Scholar]
- [19].Schwieters CD, Kuszewski JJ, Tjandra N, Clore GM, Journal of magnetic resonance 2003, 160, 65–73. [DOI] [PubMed] [Google Scholar]
- [20].Cornilescu G, Marquardt JL, Ottiger M, Bax A, Journal of the American Chemical Society 1998, 120, 6836–6837. [Google Scholar]
Associated Data
This section collects any data citations, data availability statements, or supplementary materials included in this article.


