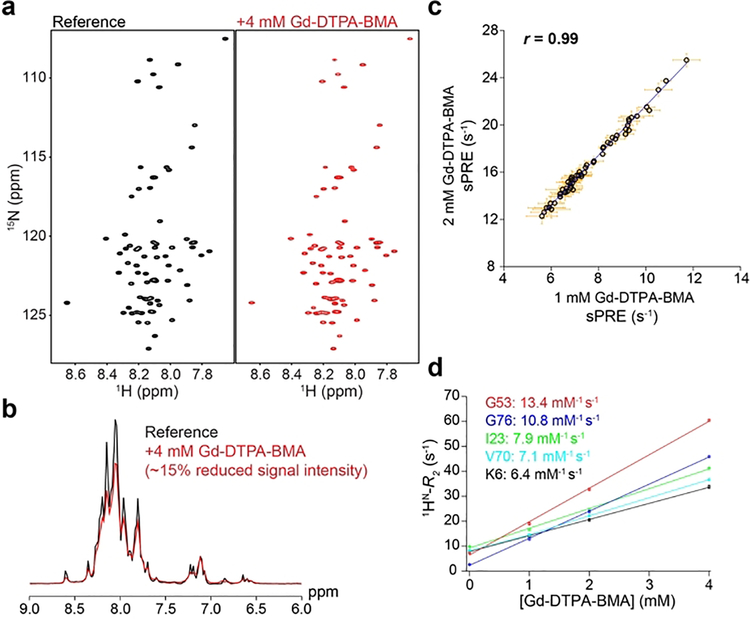
Figure 1.
sPRE studies on denatured ubiquitin. a) 1H, 15N HSQC spectra of ubiquitin denatured in 8 M urea at pH 2.5 in the absence (left, black) and presence (right, red) of 4 mM Gd-DTPA-BMA. b) Overlay of 1D projections of the spectra shown in panel a. c) Correlation of sPRE data measured in the presence of 1 mM and 2 mM Gd-DTPA-BMA. The correlation coefficient (r) is shown. d) Transverse proton relaxation rates (1HN-R2) plotted against Gd-DTPA-BMA concentrations for selected residues in urea-denatured ubiquitin. The plot shows that the change in relaxation rate as a function of paramagnetic probe concentration is linear. The slope of this line corresponds to the relaxivity for each residue (in units of mM−1s−1), which is defined as the change in relaxation rate normalized to the probe concentration.

