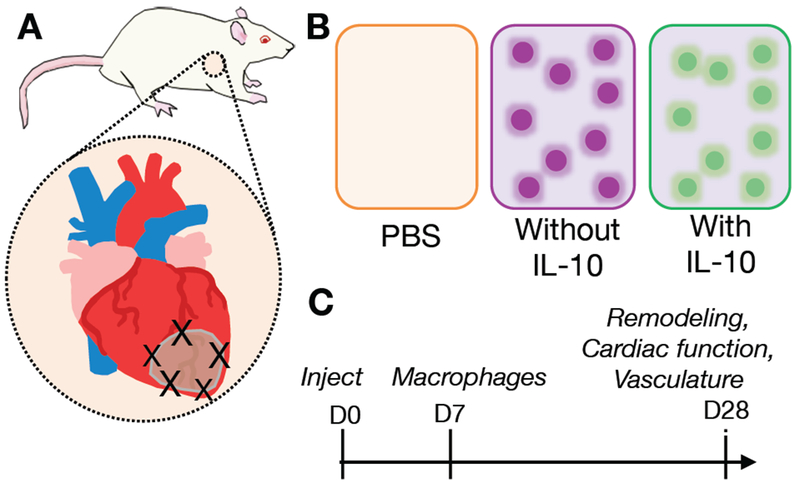
Figure 6.

Schematic of the analysis of composite hydrogels in a rat MI model, including A) injection sites in border zone of MI after LAD ligation, B) treatment groups of saline control (PBS), composites without IL-10, and composites with IL-10, C) experimental design timeline showing injection at day 0 and outcome measures after 7 and 28 days.
