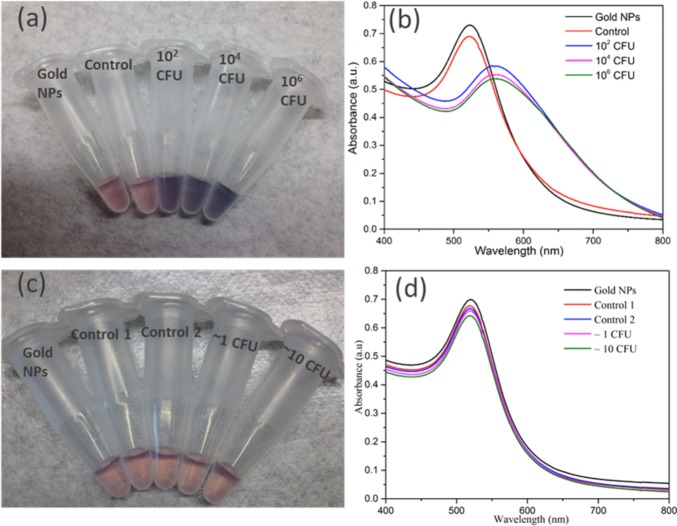
Figure 3.
Detection of E. coli with thiolated M13KE and AuNPs. (a, c) Digital photos and (b, d) UV–vis spectra are shown. From left to right in panel a, samples contain AuNPs and: no bacteria or phages (black line in panel b), unmodified M13KE with 106 CFU E. coli (red line in panel b), and thiolated M13KE with E. coli at 102, 104, and 106 CFU (blue, magenta, and green lines, respectively, in panel b). From left to right in panel c, samples contain AuNPs and no bacteria or phages (black line in panel d), unmodified M13KE phage and ∼1 or ∼10 CFU of E. coli (red or blue lines in panel d, respectively), and thiolated M13KE phage and ∼1 or ∼10 CFU of E. coli (magenta or green lines in panel d, respectively).

