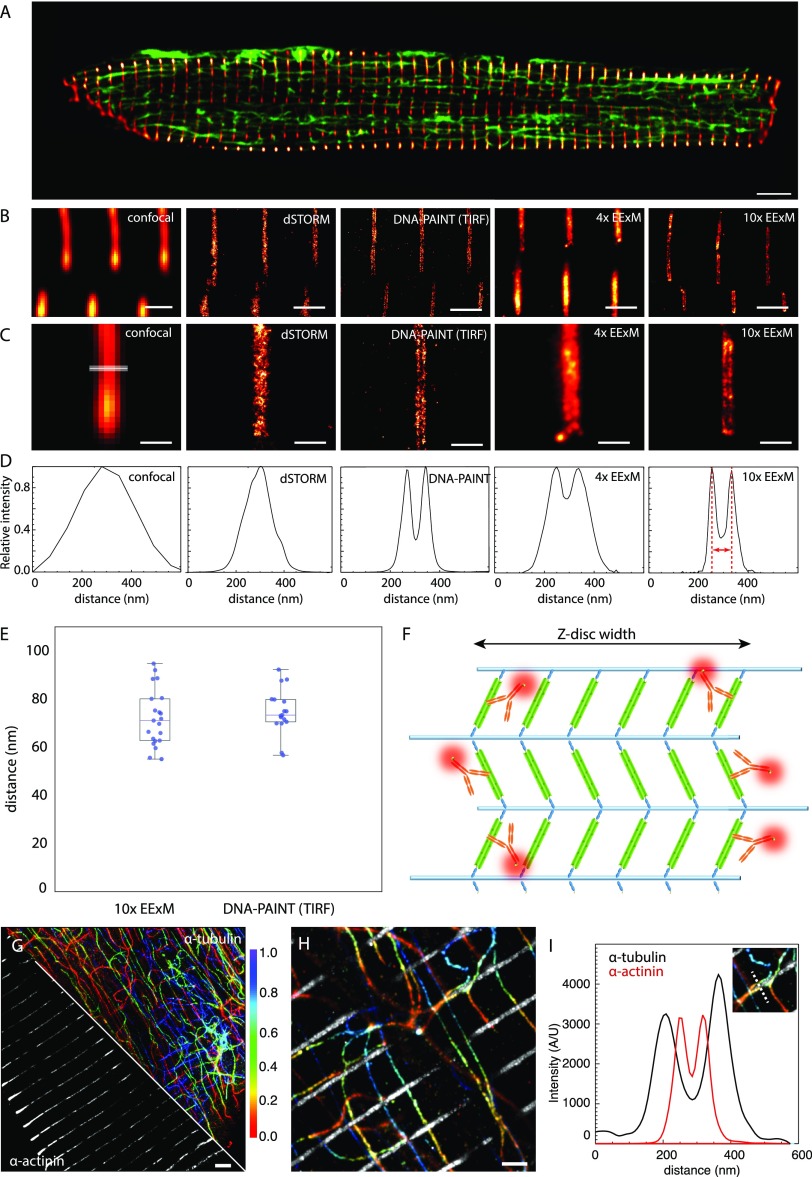
Figure 1.
Adaptation of ExM for imaging nanoscale intracellular structures in optically thick cells. (A) Overview of the shape and size of rat ventricular myocytes labeled for α-actinin (red hot) and α-tubulin (green). (B) Comparison of z-disc α-actinin immunolabeling in the cell interior mapped with deconvolved confocal microscopy, dSTORM implemented with HiLo illumination, DNA-PAINT implemented in TIRF, 4× EExM (i.e., ExM images acquired with the Airyscan protocol), and 10× EExM. (C) Magnified view of the respective images revealed only DNA-PAINT and 10× EExM could resolve the double-layer morphology of the z-disc reported by the anti-α-actinin Ab. (D) Line profiles taken across the z-discs in the respective images illustrating a bimodal intensity profile with a separation of ∼70 nm at the peaks in DNA-PAINT, 10× EExM, and, to a lesser extent, in 4× EExM data. (E) Dotplots of the measured separation between the α-actinin double-peaks as measured through 10× EExM and DNA-PAINT (Mean ± SEM: 74.05 ± 3.12 nm and 70.10 ± 2.22 nm respectively; n = 21 and 17; p = 0.31 in two-tailed t test). Overlaid box and whisker plots illustrate the 5th, 25th, 50th, 75th, and 95th percentiles. (F) This double-layer morphology was consistent with a model of the z-disc consisting of six parallel layers of α-actinin (green) anchoring actin filaments (blue); the two outermost layers are optimally labeled with Abs (orange; see Supplementary Figure S2). (G) Maximum intensity projections of a 3D 10× EExM volume of α-actinin (gray) and α-tubulin (colored for depth, indicated in μm) acquired near the center of the cell (at a sample depth of ∼ 50 μm) illustrate the capability of 10× EExM to image cellular regions far from the surface. (H) Magnified region of the same data illustrates the tessellation between microtubule bundles with the z-discs within ∼50 nm, illustrated with (I) overlaid intensity profiles of a region (dotted line in inset). Scale bars: (A) 5 μm; (B and H) 1 μm; (C) 400 nm; and (G) 2 μm (EExM scale bars adjusted to expansion factor).

