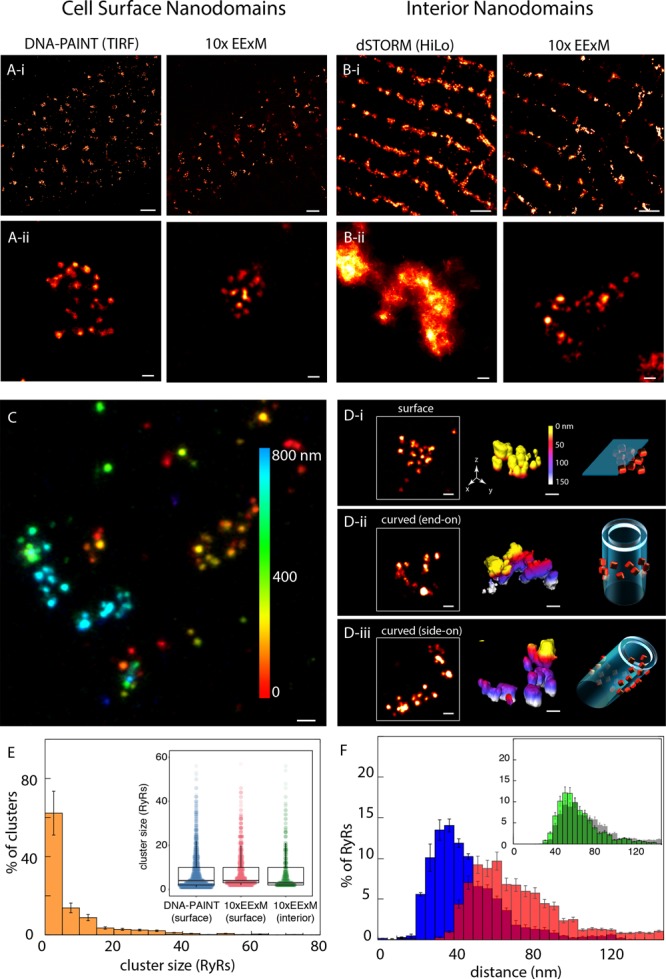
Figure 2.

Adaptation of 10× EExM for imaging RyR nanodomain in cardiac muscle cells. (A-i) Comparisons of DNA-PAINT (in TIRF; left) and 10× EExM (right) images of the RyR labeling near the cell surface of rat ventricular cardiac muscle cells, both illustrate domains of RyR labeling whose width is <500 nm. (A-ii) Magnified views illustrate clearly resolved punctate labeling densities, each corresponding to an individual RyR, in both DNA-PAINT and 10× EExM images. (B-i) Comparisons of dSTORM (with HiLo illumination) and 10× EExM images of RyR nanodomains located in the cell interiors. (B-ii) Magnified views of the respective images illustrate unresolved cluster substructure in dSTORM (left) which contrasts with the well-resolved RyR arrays in 10× EExM in cell interior (right). (C) A depth coded (color scale in nm) maximum-intensity projection of a 1 μm-deep cell volume with RyR labeling. Comparison of RyR cluster 3D topographies identified with 10× EExM raw data include (D-i) flat RyR arrays at the cell surface and curved nanodomains in cell interior visualized either (D-ii) end-on, along their axis of curvature, or (D-iii) side-on, orthogonal to the axis of curvature. Shown are the in-plane view of the nanodomains (left), surface rendered 3D 10× EExM data, color coded for depth along the optical axis (z) in nm (middle) and schematic illustration of unique topologies of RyR (orange) arrangement relative to the nearest plasmalemmal membranes (cyan). (E) Percentage histogram of the RyR cluster sizes in the cell interior nanodomains show a Mean ± SEM of 8.23 ± 0.51 RyRs/cluster; n = 11 cells, 1912 clusters. The distributions of the surface cluster sizes, as estimated with both DNA-PAINT (Mean ± SEM of 7.87 ± 0.39 RyRs/cluster; n = 12 cells, 3209 clusters) and the surface and interior clusters imaged 10× EExM, were similar as illustrated by the dot-plots overlaid with the box and whiskers plots (inset; p > 0.05 in Bonferroni-adjusted Mann–Whitney tests). (F) The distribution of NND in interior nanodomains with ≥5 RyRs (blue) showed a mean of 45.41 ± 0.75 nm. The distribution of 3ND (red) for the same RyR nanodomains had a long rightward tail (mean ± SD: 73.74 ± 14.28 nm). Overlaid with the 3ND histogram of the cell interior (gray, inset) is the equivalent distribution for subsurface RyR nanodomains (green), which was more left-shifted. Scale bars: (A-i and B-i) 1 μm; (A-ii, B-ii, C, and D) 50 nm. Error bars in plots: SD.
